

Four years ago, a major global company specializing in the manufacturing, sale, installation, and maintenance of wind turbines faced a critical challenge with its observability system. The company needed to improve the flexibility of its components and optimize its systems while also reducing costs. At that time, it was using observability software that did not provide the necessary competitive advantages, prompting the search for an alternative that could meet these needs.
The primary goal of this Nordic multinational has always been to collect metrics from more than 2,500 network devices, including routers, switches, VPNs, and firewalls, and to generate alerts based on these metrics. Five years ago, before starting its collaboration with Datadope, the company’s licensed solution covered the following monitoring areas:
- ETL: Extraction, transformation, and persistence of metrics in databases.
- Visualization.
- Alerts.
However, this tool had several critical limitations: it was not flexible enough to optimize metrics according to the company’s needs, nor did it allow for aggregating those metrics into customized dashboards by category. Additionally, its integration capacity with existing business services was limited, as it required additional specific developments and had high maintenance costs. Faced with these challenges, the company decided to migrate to open source solutions with Datadope’s support, starting a significant transformation in its observability strategy.
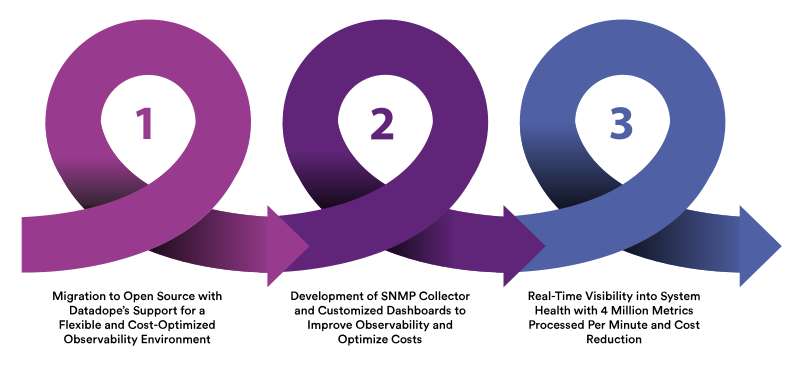
Migration to Open Source with Datadope’s Support for a Flexible and Cost-Optimized Observability Environment
Today, with the migration complete, the observability environment has transformed as follows:
- ETL: Using SNMP Collector, Kafka, and ClickHouse.
- Visualization: Grafana, with customized dashboards by technology, user scope, and custom aggregates.
- Alerts: Integration with internal services, data enrichment, and event dispatching.
Development of SNMP Collector and Customized Dashboards to Improve Observability and Optimize Costs
To achieve this transformation, several key improvements were implemented:
- Development of an SNMP Collector with extended functionalities to collect specific metrics, enrich them with custom metadata, and different resolutions.
- Creation and maintenance of specific dashboards for the operations team.
- Definition of templates to improve device performance and prevent overloads.
- Development of specific components for integration with external and internal monitoring platform services.
- Optimization of the database schema to enhance the user experience with the monitoring platform.
- Creation of customized dashboards tailored to different target audiences (executives, architects, etc.).
- Definition and automation of the lifecycle of various resources via GitOps: Devices (SNMP Collector), Dashboards (Grafana), Alerts (Grafana + Alerta).
Real-Time Visibility into System Health with 4 Million Metrics Processed Per Minute and Cost Reduction
The ultimate goal of this transformation was to gain real-time visibility into the health of its systems while reducing costs and increasing flexibility. Today, the company processes 4 million metrics per minute using open source tools supported by Datadope’s expertise.
According to the Network Connectivity and Infrastructure Product Manager at the company: We now have unprecedented real-time visibility and flexibility, all while reducing costs, thanks to open source solutions and Datadope.”

