

Although Elasticsearch became famous as a powerful search engine, today it sits at the heart of countless architectures for monitoring metrics, logs and traces. But have you ever wondered what actually happens under the bonnet from the moment data is generated to the point where you see it on a dashboard?
In this article, we will skip the introductions and get straight to the point to understand the core concepts that make Elasticsearch work its magic. We will look at how ingestion pipelines are designed to withstand massive spikes in data, how documents and indices are structured, and why strategies such as sharding and lifecycle management (ILM) are vital for keeping a cluster healthy, fast and scalable. If you want to understand the real architecture behind your data, keep reading.
How does data get into Elastic?
There are many ways to send metrics, logs and traces to Elastic, but the simplest is directly from one of its “Beats”: agents that collect information from different sources and send it to Elastic for storage.

In this case, for example, we could use Filebeat to collect logs from our application and send them to Elastic. As a visualisation layer, we would use Kibana to query them, build charts, and so on.
This architecture, while functional, is not usually found in large production environments, as it has no safeguards in place to withstand data avalanches, no centralised ingestion management and, in many cases, data collection is not based solely on Elastic Beats, since there may be multiple data sources involved.
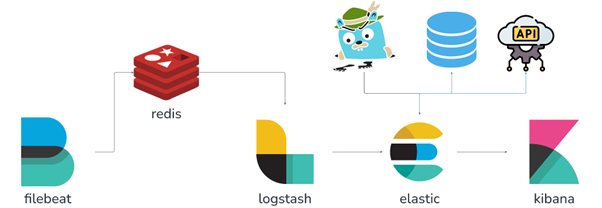
This other architecture, slightly more complex, is much closer to the reality we are talking about.
We would still have the same components as before — Filebeat, Elastic and Kibana — but now accompanied by a queueing system (Redis) to cope with traffic surges, a Logstash ingestion pipeline to process and transform the data consumed from the queue, and multiple data sources such as a database or an API, which we query directly, or Jaeger, a tracing monitoring tool that can use Elastic as its database.
How is the data stored?
Everything that reaches Elastic ultimately gets stored as a document. This is the smallest unit you will find in Elastic.
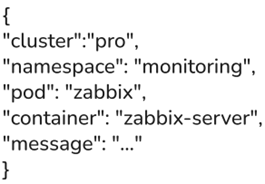
In practical terms, a document is a JSON object containing the information we collect, however we collect it, and eventually ingest into Elastic. Elastic also adds a small number of its own metadata fields.
To organise all the documents being generated, Elastic stores them inside indices. A document will generally belong to a single index, although nothing prevents it from being stored in several. We can think of an index as being similar to a database table, where each row is one of our documents.
We can think of an index as a database table where each row is one of our documents
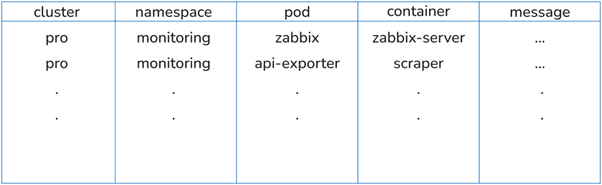
Indices allow us to group together data that is related in some way — Kubernetes container logs, for example — and that, in principle, shares the same structure. We say “in principle” because, although indices can be compared to database tables, they are not exactly the same and have the ability, among other things, to adapt to the data.
Divide and conquer
If you have ever worked with databases, this will sound familiar: putting too many things in one place is rarely a good idea. The same applies in Elastic when it comes to indices.
Keeping all the information together can lead to slow searches, costly maintenance, and a greater risk of data loss or system outages. To avoid this, Elasticsearch uses shards, which allow information to be split into much smaller, more manageable pieces.
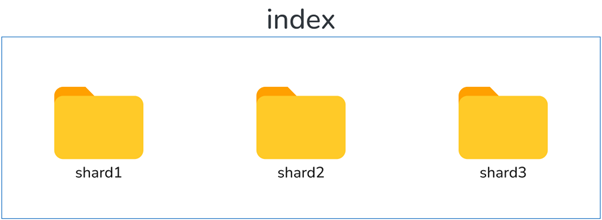
Shards allow us to divide an index — which is, in the end, a logical grouping of documents — into as many pieces as we want. They also let us manage data replication, since each shard can have its own replica shard.
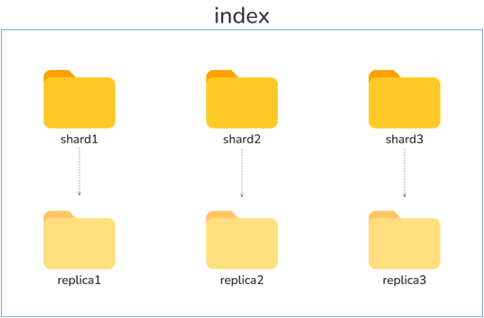
With this added functionality, day-to-day operations performed on indices — ingestion, querying, updates, and so on — become much faster. On top of that, we get an architecture that can balance load far more effectively, provide high availability and, as mentioned earlier, deliver all the advantages that come from splitting large volumes of data into smaller chunks.
And following the same logic, just as indices are divided into smaller shards, Elasticsearch itself can also be split across several nodes — at which point we have a cluster. This multiplies all the benefits of sharding. In the end, we are left with an architecture similar to this:
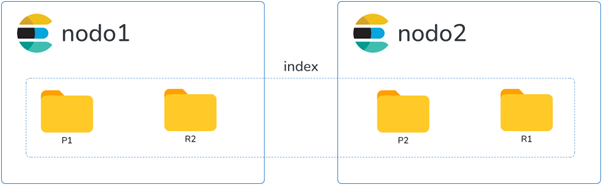
This is a highly horizontally scalable model that delivers high performance along with strong resilience against data loss. Ideally, you would have an Elasticsearch cluster with three nodes so that it can withstand the sudden failure of one of them without losing data or availability altogether — but that is a story for another day.
A constant flow of time-based data
Elasticsearch started out as a search engine that could easily have been used to index something like a recipe app, but over time it has evolved into a platform we now use to store a very different kind of data: metrics, logs and traces. The main difference with this type of data is that it is tightly bound to time.
An “ERROR” line in a log does not mean the same thing if it appears before or after a change has been deployed. In the same way, a service restart may make perfect sense at one time, but represent a critical issue at another. The point is this: these data points do not mean much without the context of time — the exact moment when they happened.
That is why this kind of data should never be modified or deleted casually. This is not a cheesecake recipe that gets refined over time as we learn new tricks. No — a log, metric or trace happens when it happens, and that is how it must be recorded and preserved.
At the same time, these data generate vastly more records — documents — than all the cheesecake recipes in the world ever could, and that becomes a problem if we are not able to manage them properly. We have already touched on why putting too much data in one place is a bad idea.
To deal with this type of data, commonly known as time series, Elastic provides data streams. In short, this is a layer above indices that allows us to manage the ingestion of time series dynamically and transparently for the user — that is, data closely tied to time that will not be modified.
Data streams effectively replace a function that used to be handled through aliases.
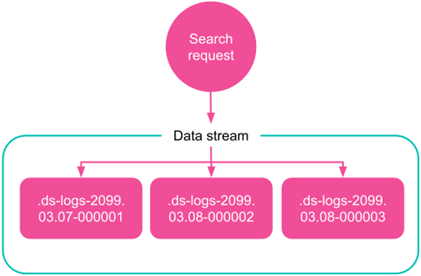
Data streams sit above indices and create a single entry point to multiple smaller indices that are created and deleted based on age or size. When we query a data stream, the query runs against the underlying indices and returns the result.
Writing to a data stream works slightly differently.
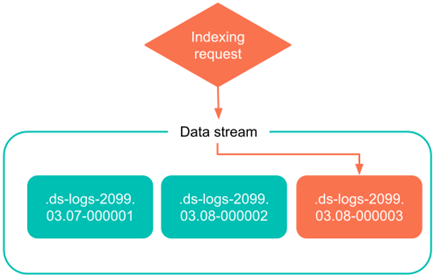
New data is not written to every index. Instead, a write index is designated — effectively the most recently created index — and that is where new records are indexed.
The circle of life
Finally, to manage the lifecycle of this whole set of indices, data streams and data, Elastic provides ILM (Index Lifecycle Management). This is based on the idea that we can have multiple nodes within our cluster that perform different roles when storing data.
We might have one node with more powerful hardware to store the most recent data, since that is likely to be queried most often, and another node with less powerful hardware but much more storage capacity, which we could use for long-term data retention.
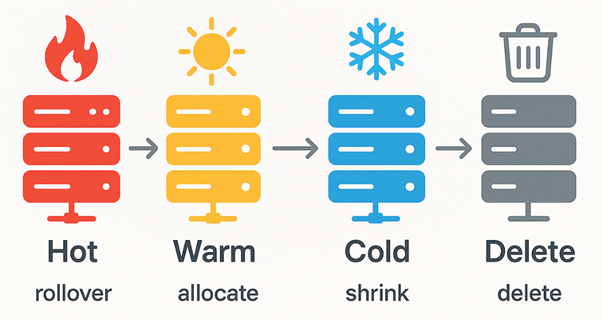
Using ILM, we can define different phases that our indices will go through.
These policies are based on the age and/or size of the index. So, for example, we might define the following phases for our “logs” index:
- 1. At the moment the index is created, it is in the hot phase.
- 2. After 7 days, it moves to cold.
- 3. Finally, 23 days later — 30 days after creation — it is deleted.
The idea is straightforward.
Because we are talking specifically about logs, users are most likely to want to review the last few days first, so we keep those on a hot node with more powerful hardware that can respond quickly to requests. After the first week, they are less likely to be queried, so we move them to a cold node, where it is cheaper to keep the data because the hardware is less powerful. At the same time, we reduce the load on the hot node, improving performance where it matters most.
Then, after a month, we delete the logs to free up space.
Bye bye
That said, we have only scratched the surface of Elasticsearch and everything its ecosystem has to offer. If you would like to dig deeper, my recommendation is to set up a simple cluster at home with Docker and follow Elastic’s official documentation, which is packed with solid explanations and practical examples.
And if, a few months from now, you become an absolute pro, try knocking on our door — there may well be a place for you.

