
Introduction: The challenge of AI observability
In the classic film Terminator, we see the world through the machine’s eyes: a red-tinted HUD with scrolling text, analysing targets and calculating probabilities.
In modern engineering, we have built the machines — large language models (LLMs) — but we often lack that “red HUD”. We send a prompt, receive a response and cross our fingers that the bill will not be too high and the answer will not be an AI hallucination.
As organisations move Generative AI (GenAI) from prototype to production-ready systems, the standard observability stack — Metrics, Logs and Traces — is becoming insufficient. This is due to two characteristics of GenAI that do not exist in traditional applications:
- LLMs are non-deterministic.
- Every call to an LLM costs money.
Assessing the health of a JSON API call is straightforward: 200 OK versus 500 Error. Assessing an LLM response is a much more nuanced exercise involving semantics and cost–benefit analysis.
In this article, we explore how to design a complete observability layer for GenAI using Grafana, Langfuse and OpenTelemetry, delivering the following benefits:
- Single Pane of Glass: a unified dashboard where we can visualise our KPIs.
- Trends and detail: analytics to track KPI trends and drill down into each one.
- Evaluations: both offline and online evaluations to ensure our AI systems are performing correctly.
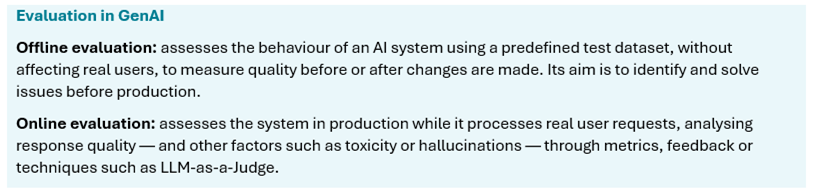
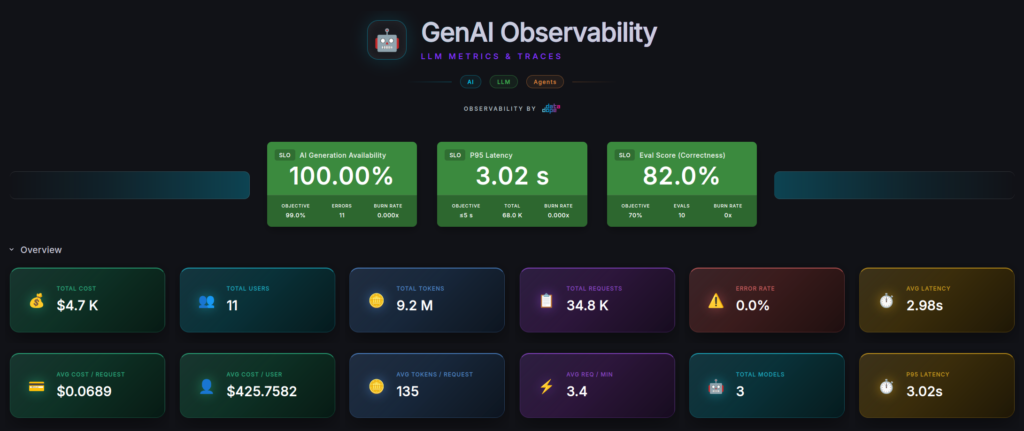
Figura 1: Single Pane of Glass).
1. The gap: why traditional tracing is not enough
OpenTelemetry (OTel) is excellent for microservices: it tells you that Service A called Service B, which then called Service C, whether errors occurred and the latency of each call. The problem arises when one of those services interacts with an LLM, because OTel often misses what matters most:
- Tokens and cost: how much did this specific user cost us? How much are we spending with that provider? How much are we spending on each model?
- Model parameters: was this response generated with temperature: 0.4 or 0.9?
- Intermediate steps: in an agent loop, what did the LLM “think” before calling a tool?
What did the MCP servers return? Which step was the most expensive?
- Quality metrics: was the response toxic? Was it factually correct, or did the AI hallucinate and fabricate the answer?
To address this, we need an observability stack designed specifically for GenAI.
2. Architecture: the GenAI observability stack
At Datadope, our architecture follows a Single Pane of Glass approach, bringing together technical performance and business value.
The components are:
- Langfuse SDK: built on OTel, it instruments the application to capture prompts, completions and metadata, allowing each operation in our code to be characterised using AI-specific concepts such as generation, tool and embedding.
- Langfuse Stack: a specialised backend that uses ClickHouse for high-performance telemetry storage.
- Grafana: the visualisation layer, which queries data directly from ClickHouse to create unified dashboards.
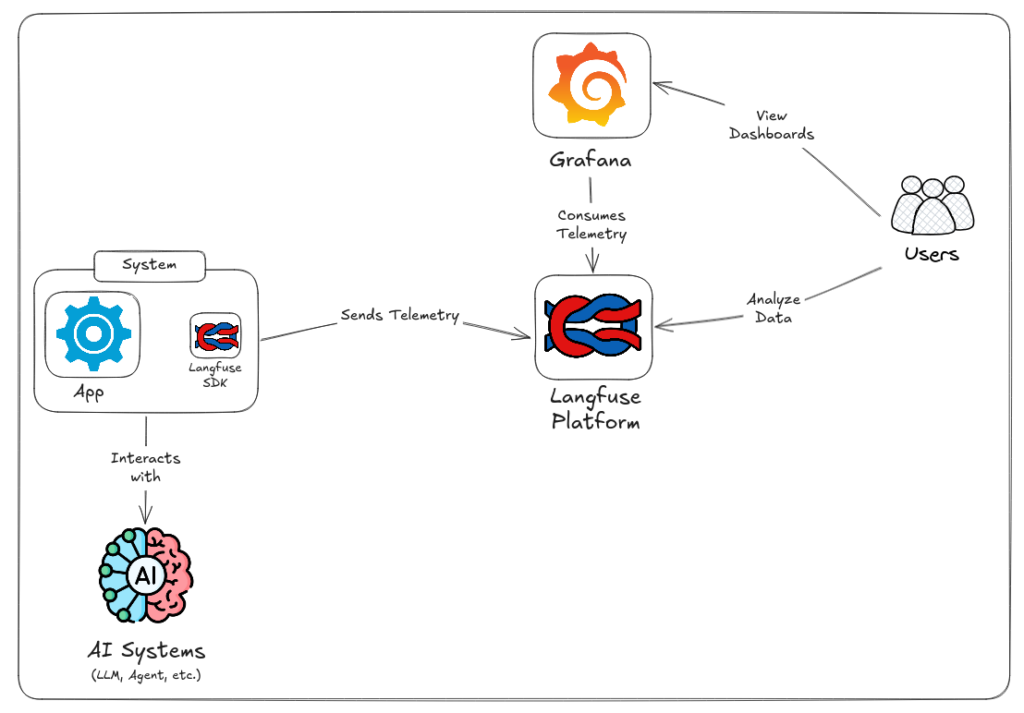
Figure 2: High-level system architecture.
3. Instrumentación de la aplicación
Let us look at how we instrument a Python service using Zero-Code Instrumentation — with minimal code changes, but advanced insights:
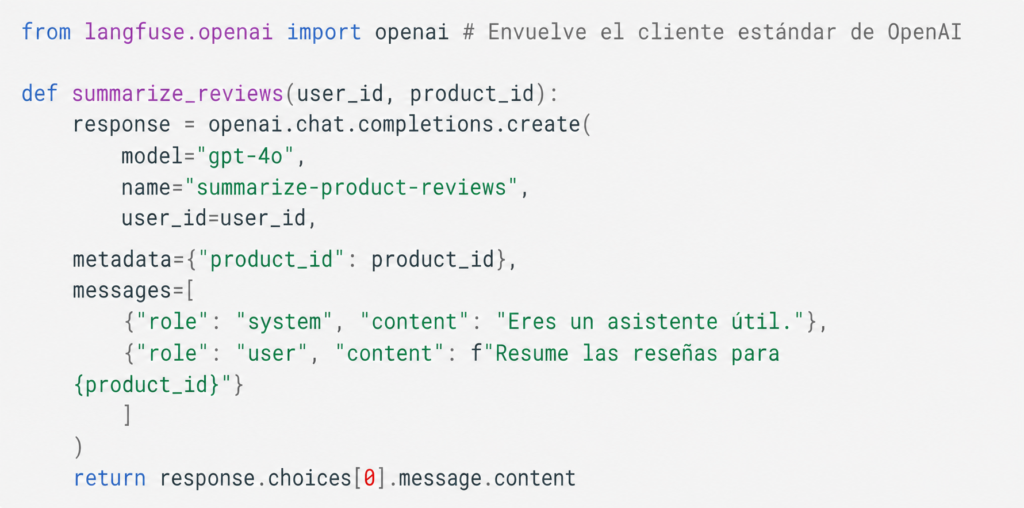
With this simple change, we can capture information about the model used, its parameters, input and output tokens, the cost of each call, cost per user and other key indicators.
4. Advanced use cases: beyond “does it work?”
A. Deep tracing
When a system interacting with LLMs uses tools, MCPs or other intermediate systems — for example, by calling a database or a search engine — the execution logic can become complex. This observability solution makes those intermediate steps visible, providing end-to-end insight into system behaviour. For example, consider a trace where the LLM decides to use a tool:
- Input: the LLM’s decision to use a tool.
- Action: the actual database call.
- Observation: the data returned to the LLM.
- Synthesis: the final response.
This is the “Eureka!” moment for developers debugging why an agent became trapped in a loop or selected the wrong tool.
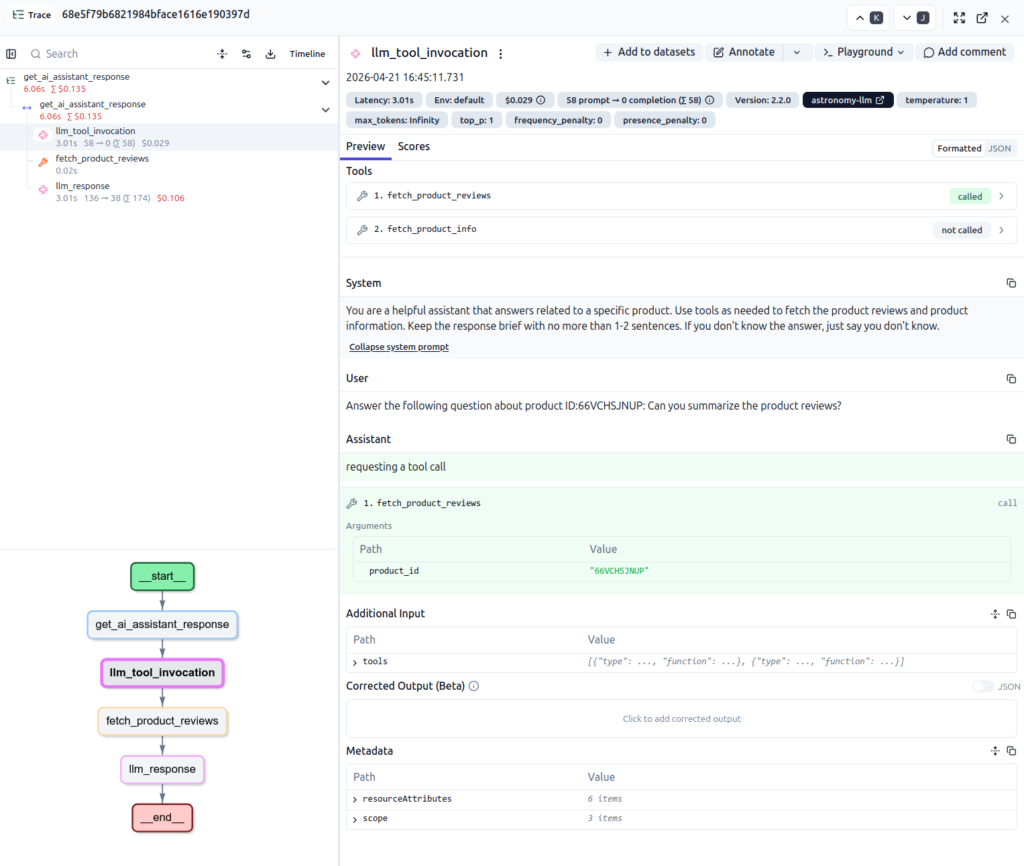
Figure 3: Detailed trace view.
B. Tracking evolution: trends and performance
Observability is not only about the here and now; it is also about trends. By aggregating telemetry in ClickHouse, we can visualise how KPIs evolve over time and identify regressions or scaling issues:
- Cost scaling: does our spend grow linearly with our user base, or is there hidden inefficiency in our prompts?
- Latency drift: identify whether a recent prompt change or model update has caused a gradual increase in p95 latency.
- Token efficiency: monitor tokens per request to ensure agents do not become trapped in redundant loops.
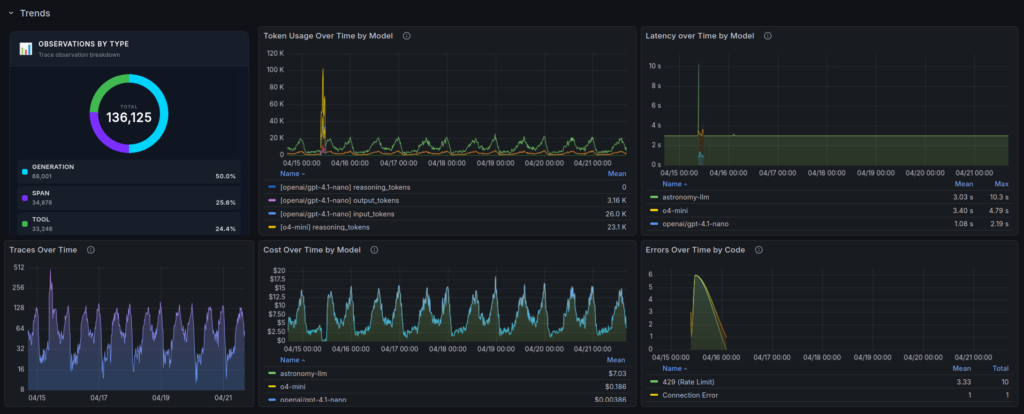
Figure 4: GenAI KPI evolution and trend analysis
C. LLM-as-a-Judge: automated scoring
How do you know whether your LLM is performing correctly? Manual review does not scale, so we implement an Evaluation Flow:
- A request is received and stored.
- A second LLM acting as the “Judge” reads the input sent to the original LLM and the output it generated — asynchronously, so user-request latency is not affected.
- The Judge assigns a score from 0 to 1. For example: “Is the information factually supported by the context provided?”
- We trigger an alert if the Correctness Score falls below a defined threshold.
- We also measure other relevant scores, such as Toxicity and Relevance.
Finally, we display the results of these evaluations in our Single Pane of Glass:
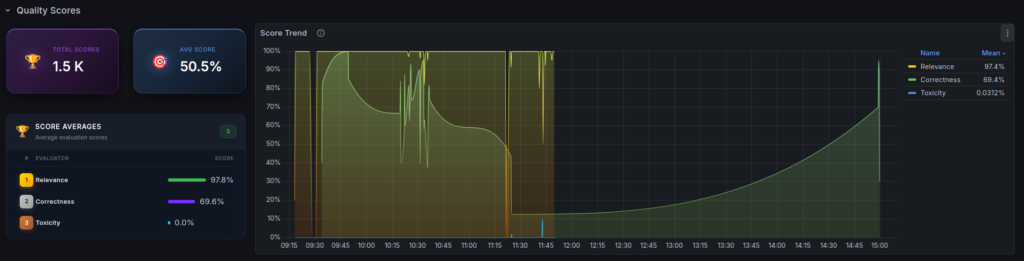
Figure 5: LLM-as-a-Judge summary.
5. Business value: the economics of Generative AI
GenAI is not only a technical challenge; it is also a financial one. We address the need for precise cost control by using Grafana to query the ClickHouse backend, enabling us to build dashboards that show:
- Cost per User/Tenant: essential for SaaS products.
- Model efficiency: are we using GPT-4 for simple tasks where GPT-4o mini would be sufficient?
- Latency: the most critical user experience (UX) metric for LLM responses.
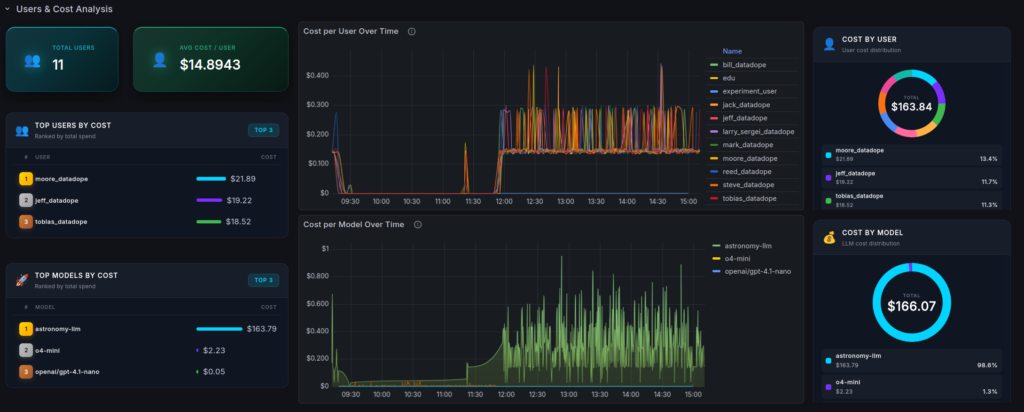
Figure 6: GenAI system costs.
6. Lessons from the field
After implementing this system for several clients, these are our most important recommendations:
- PII sanitisation: never send personally identifiable information (PII) to the observability backend. Use SDK-level masking or an OTel Collector to filter it out.
- Response latency: both instrumentation and evaluations can add overhead. Make sure your SDK operates asynchronously and does not block the response to the user.
- “Baggage” is your friend: correlation IDs in the OTel Baggage header are essential for linking user behaviour to LLM costs.
Conclusion: moving forward with confidence
Observability in the GenAI era is about moving from “I hope this works” to “I know this works”. By implementing a robust stack and following best practices, teams can finally understand what the model is doing, how much each interaction costs and whether responses meet the expected quality levels — optimising cost, performance and, most importantly, confidence in the reliable operation of their applications.
Ready to bring your GenAI stack into the light? At Datadope, we specialise in making complex systems measurable. Let’s talk about turning your AI into a governable, observable and optimised system.

Eduardo Barajas Pedrosa

