
Introduction
A few weeks ago, in the first instalment of our series on modern observability with OpenTelemetry, we took a deep dive into the complex world of microservices and cloud-native architectures. We established that traditional monitoring – simply knowing whether a service is “up” – is no longer enough.
To tackle the dreaded “unknown unknowns”, we need to go beyond answering what is happening? and address the far more critical question: why is it happening?
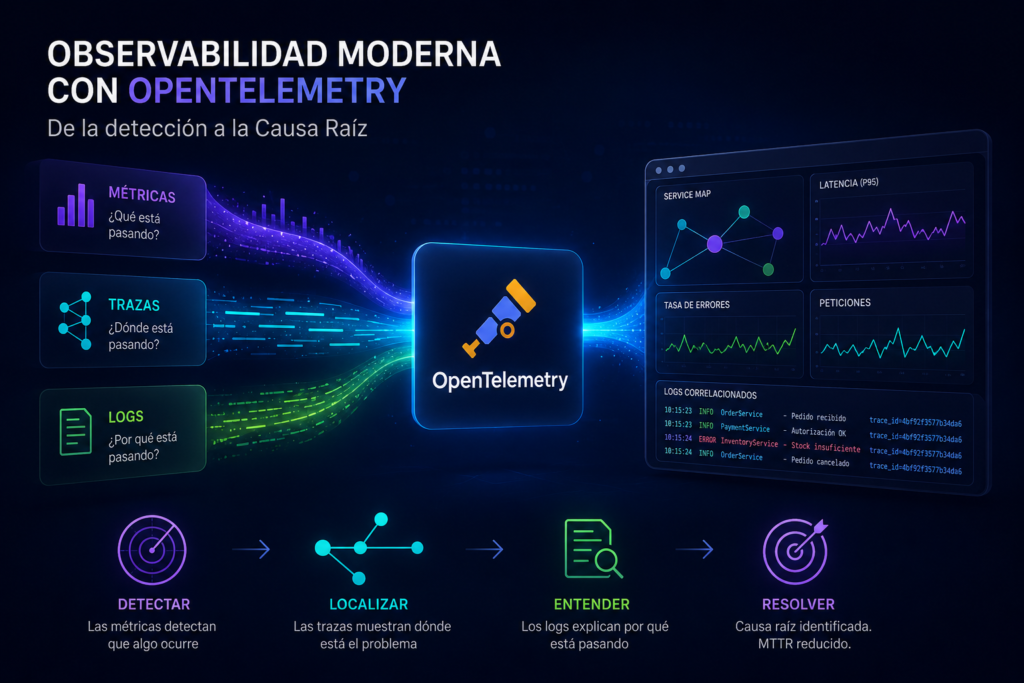
As a quick recap, in the previous article we explored the key pillars that make this possible:
- Three signals working together: We looked at how metrics detect that something is happening, distributed traces pinpoint exactly where the bottleneck lies and map the request journey, while logs provide the final context needed to understand precisely why the failure occurred.
- The power of correlation: We explored how bringing these data sources together dramatically reduces MTTK (Mean Time to Know) and MTTR, enabling teams to diagnose complex incidents faster and more effectively, with a direct impact on business performance.
- OpenTelemetry as the definitive standard: We examined this CNCF project as a powerful vendor-agnostic approach that enables organisations to instrument their applications once while maintaining flexibility across their observability stack. We also explored the two main implementation approaches: the speed of automatic (Zero-Code) instrumentation versus the full control over business logic provided by manual instrumentation using the SDK.
With the foundations firmly in place and the OpenTelemetry ecosystem clearly understood, it is time to take the next step and put the theory into practice.
With the foundations firmly in place and the OpenTelemetry ecosystem clearly understood, it is time to take the next step and put the theory into practice.
In this second part, we move from theory to implementation, exploring how to instrument an application using a simple, practical example.
Below, we break down how we instrumented this code so that it does not simply “do its job”, but is observable from the very first minute.
1. Initialisation and Configuration
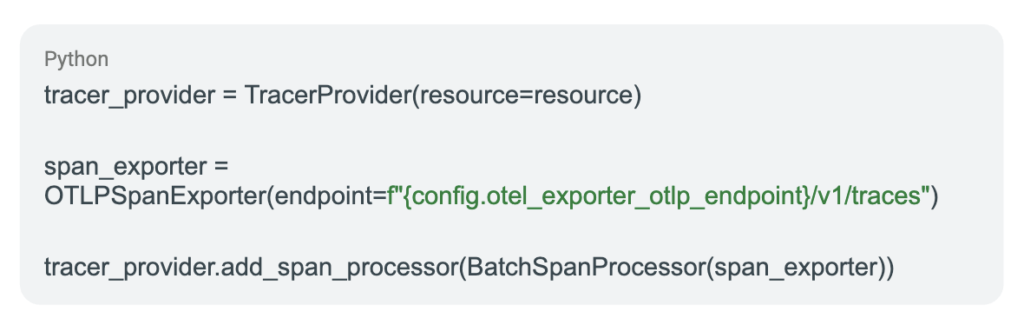
The core of our telemetry setup lies in the init_otel function. This is where we define the Resource – including metadata such as the service version and environment – and configure the OTLP exporters.
It is essential to configure both the TracerProvider and the MeterProvider so that our probe can emit structured telemetry data.
2. Instrumentation: The Data Journey (Spans)
The real power comes from creating spans around critical operations. Each stage has its own context:
- probe_run (parent span): Encompasses the entire execution. Here, we add semantic attributes such as messaging.destination or the test UID, enabling complete end-to-end traceability.
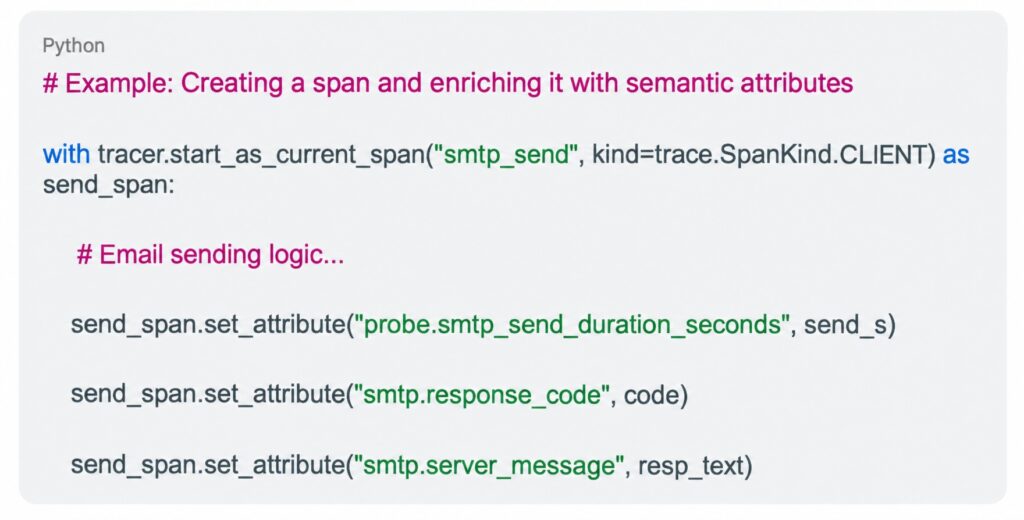
- smtp_send: Measures connection and sending time. We enriched this span with specific attributes such as smtp.response_code and smtp.server_message, capturing real SMTP protocol data that helps us understand communication failures.
- gmail_poll: A polling loop in which each iteration is represented by an individual span. This is particularly valuable because it allows us to see exactly how many attempts were required before the email was found, providing granular visibility into reception latency within our observability backend.
- gmail_delete: The final clean-up stage, also instrumented to measure latency when interacting with the Google API.
Implementing this with the SDK is straightforward. We use tracer.start_as_current_span to define each operation and set_attribute to inject critical contextual information that becomes invaluable during debugging:
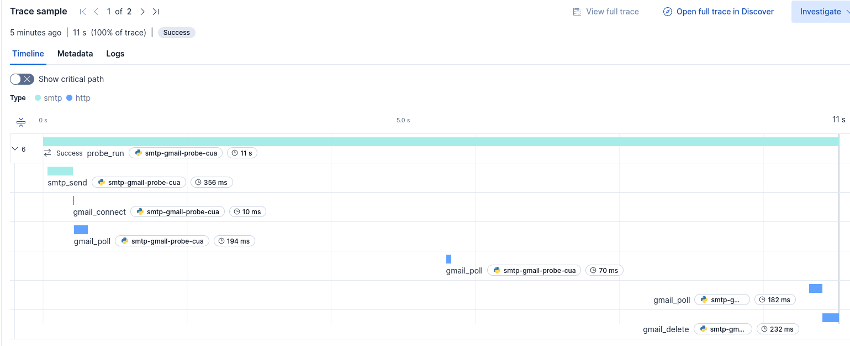
Example of a complete execution view, showing the sending time, the connection to Google, Gmail requests, the waiting periods until receipt is confirmed, and the subsequent clean-up process.
3. The “Superpower”: Log Correlation
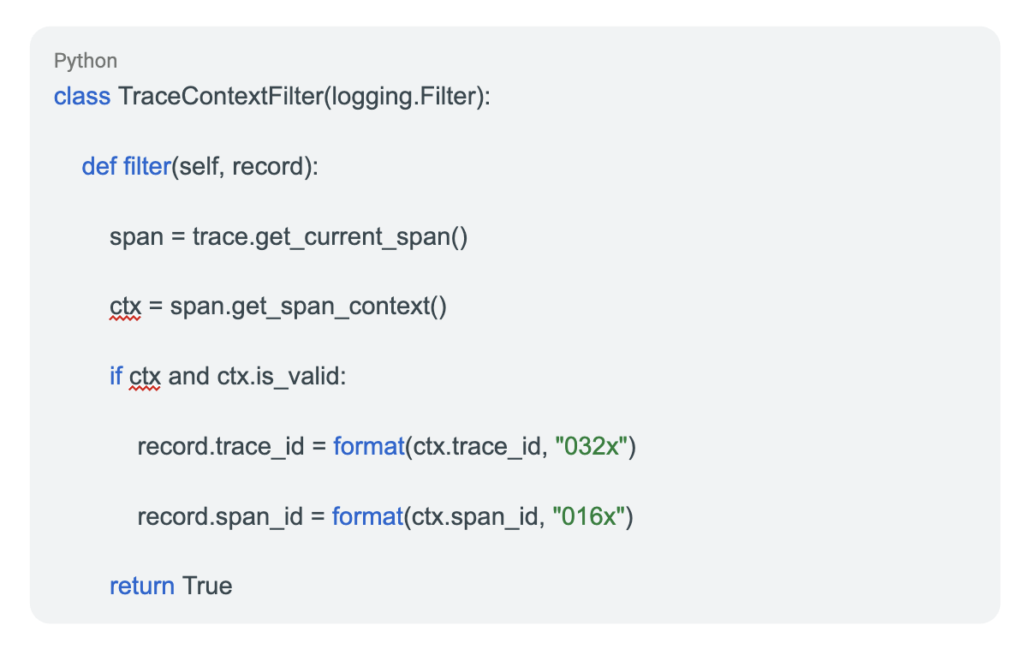
One of the standout elements is our implementation of TraceContextFilter. By inheriting from logging.Filter, we automatically inject the trace_id and span_id into every log entry.
The result? When something fails, you do not just see an error message in your logs; you also get a direct link to the exact trace associated with that error, allowing you to move from the “why” in the log to the “where” in the trace in a single click.
To achieve this automatic correlation between logs and traces, we inject the OpenTelemetry context through a custom logging filter. The filter captures the active trace_id and span_id at the moment the log is generated and adds them to the record:
With this simple change, we can capture information about the model used, its parameters, input and output tokens, the cost of each call, cost per user and other key indicators.
Metrics Management: Ensuring Telemetry Delivery
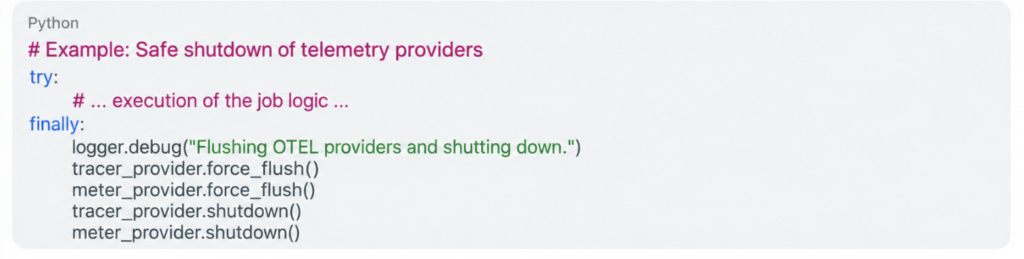
In short-lived applications or ephemeral processes, such as a Cloud Run Job, lifecycle management is critical. If the programme terminates abruptly, telemetry data still held in memory by OpenTelemetry and awaiting export may be lost.
For this reason, it is essential to perform a manual flush and a controlled shutdown before the process ends.
The finally block ensures that, regardless of whether the execution completes successfully or terminates with an error, all telemetry signals – metrics and traces – are exported to the backend before the container shuts down, ensuring the integrity and completeness of our observability data.
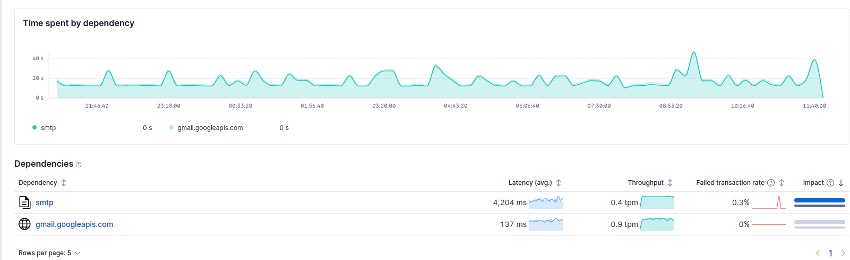
Example visualisation of the time spent across each dependent service. In our simple example, these are limited to the SMTP server and the Google/Gmail API.
Conclusion
Instrumenting an application, even in relatively simple scenarios such as a scheduled job, fundamentally changes our ability to understand how our systems behave.
As we have seen, with just a few blocks of code and a well-designed instrumentation strategy, we can move from suspecting what is happening to having data-driven certainty.
Observability is not a destination, but a continuous process of improvement. We encourage you to apply these same patterns across your own services. The clarity provided by OpenTelemetry not only makes troubleshooting easier, but also gives teams a level of confidence in their code that would otherwise be difficult to achieve.
It is time to start observing your systems like never before.
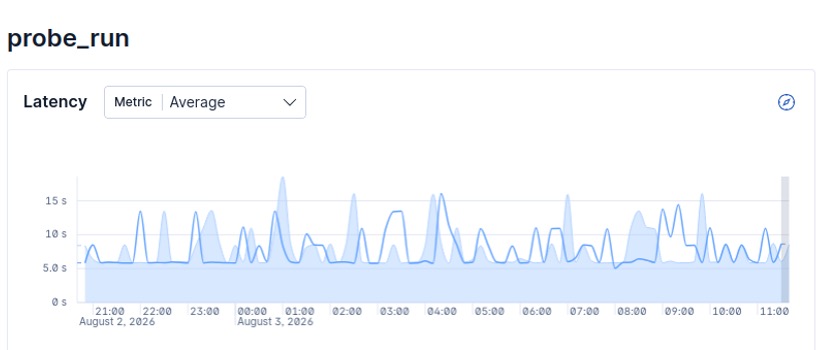
Example visualisation showing execution times throughout the previous night.
Still have questions about how to instrument your code, correlate your logs or reduce your MTTR? You do not have to make this journey alone. LinkedIn or leave us a comment!

Álvaro Olmedo.

