In the complex world of microservices and cloud-native architectures, simply knowing whether a service is “alive” is no longer enough. We need the ability to understand the internal state of our systems without having to guess where failures may lie.
In this article, we take an in-depth look at Observability, the cornerstone of modern distributed systems management. We will see how this discipline goes far beyond traditional monitoring, enabling teams to answer the critical question: Why is this happening? That is what makes it possible to tackle the dreaded unknown unknowns. We will also explore how OpenTelemetry has emerged to standardise and simplify this entire process.
1. What is Observability?
Observability is the ability to understand the internal state of a system through the data it produces, known as telemetry. It goes far beyond traditional monitoring.
While monitoring answers What is happening? (for example, “CPU usage is at 90%”), Observability allows us to answer the far more important question: Why is it happening? It helps teams deal with unknown unknowns — issues that were not anticipated in advance.
The foundations of observability are high cardinality, high dimensionality and the ability to explore data freely and in context.
2. The foundation of Observability: the three signals
To achieve a deep understanding of a system’s internal state, Observability does not rely on a single type of data, but on an orchestrated collection of telemetry. Only by combining and correlating these sources of information can teams gain the diagnostic power required to navigate complex distributed systems.
To build this complete view, observability is based on three core types of telemetry, all of which must be correlated with one another:
- Metrics: answer WHAT is happening. These are aggregated numerical data points that indicate that “something is happening”. Examples include CPU usage or the number of requests per second.
- Traces and distributed tracing: answer WHERE it is happening. They show the full path of a request as it moves through a distributed system. This makes it possible to isolate the specific component or service causing the bottleneck or error.
- Logs: answer WHY it is happening. They provide the precise detail behind the issue: error messages, variable values and the exact failure context. A correlated log may show, for example, “Error: DB timeout”.
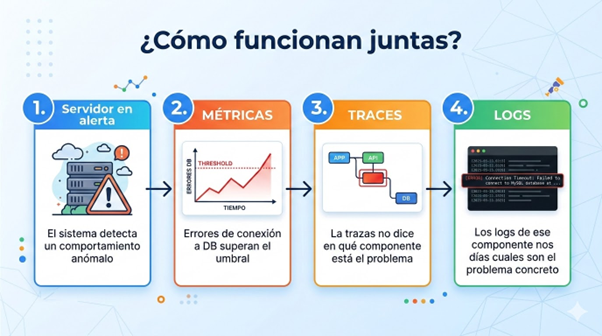
Together, they solve the mystery: metrics detect what is happening, traces show where the issue is occurring, and logs explain what exactly is going wrong.
This dramatically reduces MTTK (Mean Time to Know), allowing a single engineer to diagnose complex incidents without prior knowledge of the system.
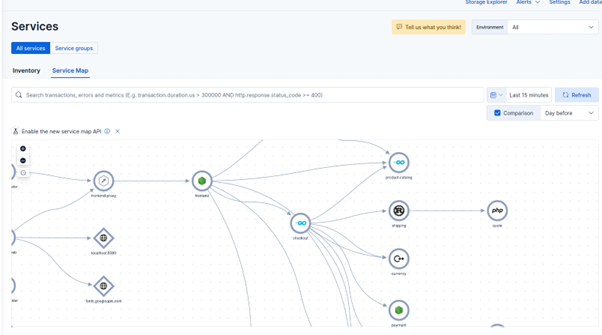
In addition, OTEL signals make it possible to understand how services relate to one another through traces that show the “journey” of a user request across different services. For example, these signals can be visualised in Kibana using OTEL data stored in Elasticsearch.
3. Why is Observability critical today?
The growing need for observability is being driven by the complexity of modern architectures:
- Distributed architectures: modern systems such as microservices, serverless and multi-cloud environments have exponentially increased complexity, creating multiple points of failure.
- Cascading failures: reducing MTTR (Mean Time to Resolution) and MTTD (Mean Time to Detect) is essential to understand and control architectures with many moving parts.
- Team scalability: observability enables anyone to investigate issues without depending on a specific expert or team with deep system knowledge.
Business impact
Organisations with mature observability practices can achieve up to a 90% reduction in resolution time (MTTR) and prevent up to 60% of incidents before they affect end users.
4. Observability vs traditional monitoring
These are not competing disciplines, but complementary ones. Monitoring provides information; observability provides the deep context needed for investigation.
| Traditional Monitoring | Modern Observability |
| Focus: collects data on system health using predefined thresholds | Focus: analyses a system’s internal state through its outputs to understand behaviour |
| Answers: Is it broken? Has it crossed the threshold? | Answers: Why is it broken? How does it affect users? |
| Data: predefined metrics, low cardinality, aggregated data | Data: arbitrary exploration, high cardinality, raw and correlated data |
| Timeframe: reactive, responding to known issues | Timeframe: proactive, enabling diagnosis of unknown unknowns and unforeseen issues |
5. OpenTelemetry: the standard project
The complexity of instrumenting each microservice across different languages and backends has been addressed by OpenTelemetry (OTel).
- Open standard: OpenTelemetry is a CNCF (Cloud Native Computing Foundation) project currently at incubation level. It was created through the merger of OpenCensus (Google) and OpenTracing (CNCF) in 2019. It is now the CNCF’s second most active project after Kubernetes.
- Instrument once: it provides a unified, vendor-agnostic framework for instrumentation. This allows teams to instrument their applications once and send telemetry data to any observability backend, eliminating vendor lock-in.
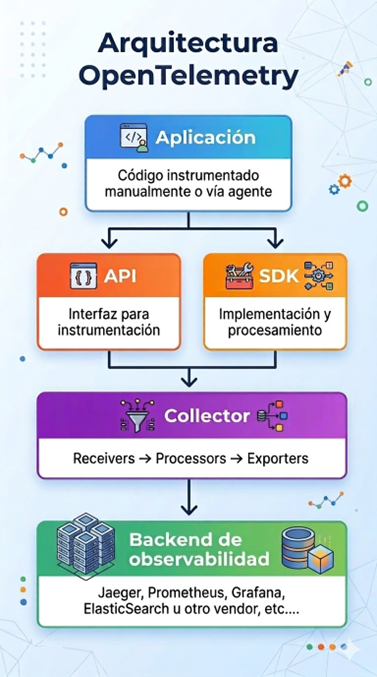
- Key components: OpenTelemetry defines APIs, SDKs and OTLP (OpenTelemetry Protocol), the standard protocol for transmitting telemetry data and integrating with multiple backends.
6. OpenTelemetry components
- Specification: defines cross-platform requirements for APIs (data types and operations), SDKs (implementations), and data (OTLP protocol and semantic conventions).
- Collector: a vendor-agnostic proxy that receives, processes and exports telemetry in multiple formats, including OTLP, Jaeger, Prometheus and commercial tools.
- Language-specific APIs/SDKs: implementations that allow teams to instrument code, integrate with popular frameworks and export data to backends.
- Zero-code instrumentation: agents that instrument applications without requiring source-code changes, such as the Java Agent.
7. Implementing Observability: instrumentation approaches
Instrumentation is the process of adding code or configuration to an application so that it emits observability signals — traces, metrics and logs. It is how the application “speaks” and communicates its behaviour.
Best practice combines automatic instrumentation for rapid infrastructure visibility with manual instrumentation to capture the most critical business data.
1. Automatic instrumentation (Zero-Code Instrumentation)
This is the fastest method and does not require any changes to the application source code.
- Mechanism: it uses agents, such as the OpenTelemetry Java Agent, or framework starters, such as Spring Boot starters. These intercept calls to common libraries including HTTP, databases and messaging systems.
- Implementation example (Java Agent):
java -javaagent:opentelemetry-javaagent.jar -jar jar - Description: runs the Java application while loading the instrumentation agent before the application code starts, generating telemetry for common operations.
- Zero-code instrumentation in Kubernetes with the OpenTelemetry Operator
- In Kubernetes environments, the OpenTelemetry Operator can automatically inject instrumentation agents as initContainers into Pods.
- By simply marking the desired namespaces or Pods with an annotation or label, the Operator automatically updates the deployment configuration so that applications start emitting OpenTelemetry telemetry.
- Key advantage in Kubernetes: centralised, scalable instrumentation management for hundreds of microservices without touching deployment files or application code.
- Benefits / capabilities:
- Fast: ideal for a quick start, legacy applications, or gaining infrastructure telemetry at speed.
| Feature | Agent (Java Agent) | Operator (Kubernetes) |
| Typical environment | Virtual machine or individual container | Cloud-native environments (Kubernetes) |
| Mecanismo | Argumento de línea de comandos (-javaagent) | Inyección del aganete usando initContiner automática (Zero-Code) |
| Advantage | Simple and universal for that language | Centralised, scalable and automated across the orchestration layer |
2. Manual instrumentation with SDK (code changes required)
This approach gives teams full control to capture domain-specific business logic by writing code with the OpenTelemetry API.
- Mechanism: developers insert SDK calls to create spans and add metrics at key points in the business logic.
- Implementation example (Java Tracing):
Span span = tracer.spanBuilder("processPayment").startSpan();

try {

// tu lógica de negocio

} finally {

span.end();

}
- Description: creates a new span called processPayment, which is added to the current trace and measures the exact duration of that business operation.
- Benefits / capabilities:
- Full control: captures business logic specific to your domain.
- Customisation: ideal for custom metrics and trace data tailored to the needs of the organisation.
Modern observability has transformed the way we manage complex architectures, enabling organisations to move from purely reactive traditional monitoring to a proactive model that helps teams truly understand the why behind system issues.
By combining and correlating the three core signals — metrics, traces and logs — teams gain the ability to detect anomalies quickly, identify the affected component with precision, and understand the exact nature of a failure without guesswork.
Within this ecosystem, OpenTelemetry has established itself as the definitive solution, offering an open, vendor-neutral standard that allows applications to be instrumented just once. Whether through automatic instrumentation for fast results without touching code, or manual instrumentation to capture the most critical business logic, adopting these practices is a game changer.
In the end, all of this translates into direct, measurable business impact: more agile teams, a dramatic reduction in MTTR, and the ability to prevent incidents before they reach end users.
And you — where are you on your observability journey?
We would love to hear about your experience first-hand.
Leave us a comment below and tell us: what telemetry or monitoring tools are you currently using in your projects? What has been the biggest headache — or unknown unknown — you have faced when trying to trace a production issue?
Álvaro Olmedo-Rodríguez. System Engineer. Datadope Datadope