

1. Introduction
More and more developers and engineers are building LLM-based applications and taking them into production. The rise of frameworks, APIs and hosting platforms makes launching prototypes faster than ever. However, a major challenge remains: how do we properly monitor an LLM to detect problems, keep costs under control, and ensure that its behavior aligns with our product goals and values?
In this post, you will discover why observability and monitoring of LLMs differs from traditional software monitoring, what categories of metrics you should look at, and how to implement a simple architecture using open source tools and the OpenAI API (applicable to other vendors as well). By the end, you will have more clarity about what and how to monitor, and you will have reproducible code samples that you can customize to your needs.
2. Why is Monitoring and Observing an LLM different?
Unlike traditional software, where failure points are usually deterministic (exceptions, logic errors, etc.), an LLM produces “non-deterministic” responses based on probability distributions. From one day to the next, your model can:basadas en distribuciones de probabilidad. De un día para otro, tu modelo puede:
- Freak out: it generates plausible but incorrect text.
- Expose biased or toxic content.
- Go out of context: e.g., respond with something irrelevant.
These situations do not necessarily result in a classic error; LLM does not “warn” you that it is hallucinating or generating questionable content. Traditional software alerts (error logs, CPU metrics, etc.) are not enough. You need deeper observability, with metrics that capture the quality and reliability of the generated text.
3. Three Categories of Metrics to Monitor
To organize your LLM monitoring strategy, it is useful to separate it into three broad categories: Cost, Quality and Output. Each category addresses a different type of risk and need.
Costs
Quality
Output
3.1. Costs
Running an LLM can involve high costs, especially if you use a third-party model with tokenized billing (e.g., OpenAI, Anthropic). Even if you run the on-premise model, GPU servers can drive up your infrastructure expenses. Key cost metrics include:
- Number of Traces: how many calls are made to the LLM in a period of time.
- Duration (Latency): the average latency and p95/p99 for each request.
- Token Usage: input and output tokens (prompt and response) to understand if your prompts are too long or the model is returning excessive responses.
- Estimated Cost: multiply the total token usage by the price per token.
Monitoring these indicators allows you to keep ROI under control and anticipate demand spikes that make your service more expensive.
3.2. Quality
In generative AI, “quality” is not just how “right” the answer is, but whether it conforms to security, moderation, and user experience limits. Some important metrics:
- Hallucinations: whether the model invents facts or data.
- Moderation: inappropriate, offensive or hostile responses.
- User Feedback: ratings or reviews that your users give to the responses, as well as manual evaluations of your team.
Although many times you use guardrails to filter out problematic content, you need to continuously monitor the actual quality of the responses. For example, a metric such as “block” rate may reveal an increase in malicious or toxic prompts.
3.3. Output
The content generated by the LLM may present syntactic, semantic or formatting problems. To monitor the quality specific to your use case, consider implementing custom metrics, such as:
- “LLM as a Judge”: use another LLM call to judge the accuracy of the original response (an evaluator prompt that generates a score).
- Consistency metrics: assess whether the LLM maintains factual consistency in summaries or in multi-turn dialogs.
- Format integrity: the response matches an expected JSON schema or a predefined format.
Not all of these metrics are cheap to implement (e.g. every “LLM as a Judge” leads to another call), but they provide visibility into the actual quality of the content you serve to your users.

4. Simple Observability Architecture with OpenAI and OSS Tools
Let’s see a practical example of how to instrument your application with traces and dashboards. Imagine you are building a chatbot that generates cooking recipes:
- You make LLM API calls: for example, using gpt-4o or sonnet.
- Automatic Logs: each interaction is automatically logged in an observability OSS platform (e.g. Langfuse, Comet Opik or other).
- Metrics Definition: you set your cost, quality and output metrics (e.g. “hallucination_score”, “token_usage”, “user_feedback”).
- Dashboards with Alerts: you visualize everything in dashboards and set up alerts (Slack, PagerDuty, emails, etc.).
The key step is to decorate or intercept your LLM calls so that, every time you generate a response, the platform picks up automatically:
- Cost information: tokens used, latency.
- Inbound and outbound content: prompts and responses (respecting privacy).
- Customized metrics: an evaluator prompt to score the output.
This way you will get detailed traces, seeing each interaction (prompt/response), its cost in tokens, latency, user feedback and possible moderation flags. You can then set up alerts to receive notifications in case of:
- Abnormal latency spikes.
- High rate of hallucinations.
- Sudden increase in costs.
Although each tool differs in syntax, the idea is always similar: use a decorator (or middleware) that captures the LLM call and sends the information to your observability system.
5. Code Example
Below is a simplified example in Python, using OpenAI and an observability library called Opik:
					import json
import openai
from openai import OpenAI

import opik
from opik import opik_context
from opik.integrations.openai import track_openai

# Instancia del cliente de OpenAI, instrumentado con Opik
cliente = track_openai(OpenAI())

@opik.track(flush=True)
def generar_receta(nombre_plato: str) -> tuple[str, dict]:
    """
    Genera una receta de cocina a partir del nombre de un plato, evalúa
    su calidad y recopila feedback del usuario. Retorna el texto de la
    receta y un diccionario con la evaluación.
    """
    # Prompt principal para generar la receta
    mensajes = [
        {"role": "system", "content": "Eres un chef experto."},
        {
            "role": "user",
            "content": (
                f"Eres un chef de primera clase. Genera una receta para {nombre_plato}.\n"
                "La receta debe incluir:\n"
                "- Lista de ingredientes con cantidades\n"
                "- Pasos detallados de preparación\n"
                "- Tiempo de cocción\n"
                "- Nivel de dificultad\n"
                "- Calorías aproximadas"
            ),
        },
    ]

    respuesta = cliente.chat.completions.create(
        model="gpt-4o-mini",
        messages=mensajes,
        max_tokens=500,
        temperature=0.7
    )

    receta_texto = respuesta.choices[0].message.content

    # Evalúa la receta generada
    evaluacion = evaluar_receta(receta_texto, nombre_plato)

    # Muestra la receta en consola
    print("\n" + "=" * 50)
    print(receta_texto)
    print("=" * 50)

    # Advertencia en caso de "alucinaciones" detectadas
    if evaluacion['tiene_alucinaciones']:
        print("⚠️ Advertencia: Esta receta puede contener información incorrecta.")

    # Recopila feedback del usuario
    feedback, comentario = obtener_feedback_usuario()

    # Envía métricas de feedback a Opik
    opik_context.update_current_trace(
        feedback_scores=[
            {
                "name": "calidad_receta",
                "value": evaluacion["puntuacion"] / 10.0,
                "reason": evaluacion["explicacion"],
            },
            {
                "name": "formato_correcto",
                "value": 1.0 if evaluacion["formato_correcto"] else 0.0,
            },
            {
                "name": "sin_alucinaciones",
                "value": 0.0 if evaluacion["tiene_alucinaciones"] else 1.0,
            },
            {
                "name": "feedback_usuario",
                "value": feedback / 5.0 if feedback is not None else 0.0,
                "reason": comentario if comentario else "Sin comentarios",
            },
        ]
    )

    return receta_texto, evaluacion

def evaluar_receta(receta_texto: str, plato_solicitado: str) -> dict:
    """
    Envía la receta a un evaluador (otro modelo) para comprobar su
    calidad, formato y posibles alucinaciones. Devuelve un diccionario
    con los campos:
        - puntuacion (int, 1 a 10)
        - tiene_alucinaciones (bool)
        - formato_correcto (bool)
        - explicacion (str)
    """
    prompt_evaluador = (
        f"Eres un experto evaluador de recetas. Analiza la siguiente receta para {plato_solicitado}:\n\n"
        f"{receta_texto}\n\n"
        "Evalúa los siguientes aspectos y devuelve un JSON con estos campos:\n"
        "1. puntuacion: del 1 al 10, ¿qué tan buena es esta receta?\n"
        "2. tiene_alucinaciones: true/false, ¿contiene ingredientes imposibles o pasos irreales?\n"
        "3. formato_correcto: true/false, ¿incluye todos los elementos solicitados?\n"
        "4. explicacion: breve explicación de tu evaluación\n"
    )

    try:
        evaluacion_respuesta = cliente.chat.completions.create(
            model="gpt-4o-mini",
            messages=[
                {"role": "system", "content": "Eres un evaluador de recetas objetivo."},
                {"role": "user", "content": prompt_evaluador},
            ],
            max_tokens=300,
            temperature=0.2,
            response_format={"type": "json_object"}
        )
        return json.loads(evaluacion_respuesta.choices[0].message.content)

    except Exception as e:
        print(f"Error en evaluación: {e}")
        return {
            "puntuacion": 5,
            "tiene_alucinaciones": False,
            "formato_correcto": False,
            "explicacion": "Error en la evaluación automática"
        }

def obtener_feedback_usuario() -> tuple[int | None, str | None]:
    """
    Solicita al usuario una puntuación de 1 a 5 y un comentario adicional.
    Retorna la puntuación y el comentario (o None si hay error).
    """
    print("\n--- Ayúdanos a mejorar ---")
    try:
        puntuacion = int(input("Del 1 al 5, ¿qué tan útil fue esta receta? "))
        comentario = input("¿Algún comentario adicional? (opcional): ")
        print(f"Feedback registrado: {puntuacion}/5")
        if comentario:
            print(f"Comentario: {comentario}")
        return puntuacion, comentario
    except Exception as e:
        print(f"Error al registrar feedback: {e}")
        return None, None

def main():
    print("🍳 Asistente de Recetas con Observabilidad 🍳")
    plato = input("¿Qué plato quieres cocinar?: ")
    generar_receta(plato)

if __name__ == "__main__":
    main()
The above code combines content generation with an LLM and the capture of observability metrics using the Opik library. The key sections are:
- Client Initialization and Decoration:
The OpenAI client is configured, and a decorator is applied to intercept each call, allowing the capture of relevant data such as token usage, latency, and cost. - Recipe Generation and Evaluation:
The generate_recipe function builds the prompt, retrieves the model’s response, and evaluates the quality of the recipe through the evaluate_recipe function. Additionally, it collects user feedback and updates performance metrics. - Middleware Usage:
With observability logic centralized through decorators and trace context updates, a complete view of each interaction is achieved, facilitating real-time monitoring and historical analysis.
For effective monitoring, it is essential to have visual dashboards displaying, among other things:
- Real-Time Metrics Dashboard:
Visualization of the number of calls, token usage, latency, estimated cost, and custom metrics.
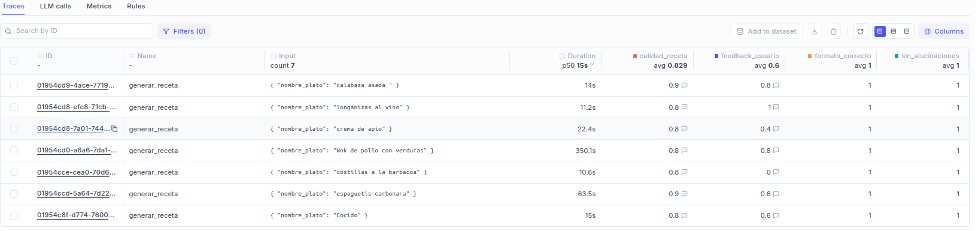
- History of Records:
Detailed log of each interaction to analyze system evolution, detect anomalies, and perform troubleshooting.

6. Use Case: Hallucination Monitoring
Hallucinations are one of the biggest challenges in LLMs. To mitigate them, two main approaches are commonly used:
- Moderation or Classification:
Each response is passed to a classifier (another model or a moderation endpoint) that flags whether the response is questionable or sensitive. - Self-Evaluation (“LLM as a Judge”):
Your pipeline calls a second prompt that scores how accurate the first response is.
Example of an evaluation prompt:
					evaluation_prompt = f"""
Eres un corrector experto en recetas.
Puntúa del 0 al 10 la veracidad de esta receta:
{receta_generada}
Explica brevemente tu puntuación.
"""
The result of this second call might return something like: { “score”: 7,
“explanation”: “Overall, it is correct, but some ingredients are
missing.” }. With this score, you can set up alerts when it falls below a threshold (e.g., 5) or log it as a “hallucination_score” metric.
Although this approach incurs additional costs (as each evaluation requires another API call), it provides proactive error detection and helps prevent false content that could negatively impact the user experience.
7. Best Practices: Alerts and Workflows
Here are some suggestions to optimize your monitoring system and problem prevention strategies:
- Monitor Costs in Real Time
- Implement metrics for token usage, latency, and the number of traces.
- Adjust prompt and response length to avoid excessive billing.
- Compare the performance of different models or versions to optimize cost-benefit ratio.
- Evaluate Quality and Moderation
- Apply guardrails to filter inappropriate or potentially harmful content.
- Use moderation pipelines or evaluation prompts to assess accuracy and detect biases.
- Log the most critical failure cases and refine your prompts or perform fine-tuning if necessary.
- Output Observability
- Design custom metrics: JSON format validation, dialogue coherence, factual consistency, etc.
- Ensure response structure integrity, especially if consumed by other systems.
- Sampling vs. Continuous Evaluation
- Consider applying statistical sampling (e.g., 10% of requests) to balance evaluation costs and quality coverage.
- For high-impact cases (financial, medical), a more exhaustive evaluation of all calls may be necessary.
- Contextualized Alerts
- Include information about recent prompts and responses in alerts to facilitate debugging.
- Integrate alerts with Slack, PagerDuty, or other notification services.
- Use of Decorators/Middleware
- Intercept LLM calls to automatically collect latency, token usage, estimated cost, etc.
- Extend this logic to all endpoints or workflows calling the LLM, maintaining a unified view.
8. Conclusion
Implementing a monitoring and observability system for LLMs is essential to:
- Control Costs: Understand exactly how much you spend on each interaction.
- Ensure Quality: Detect hallucinations and toxic or inappropriate content.
- Customize Your Output: Add custom metrics that reflect success in your specific use case.
Beyond the technical aspects, this translates into responsibility, transparency, and efficiency when operating generative AI applications. Remember, observability is not a one-time event but a continuous process of learning, measuring, and refining. If you plan to implement your own monitoring strategy, experiment with the mentioned tools (or similar alternatives) to find the best fit for your needs.
9. Frequently Asked Questions (FAQs)
- What open-source tools can I use to monitor LLMs?
There are several options, such as Langfuse, Comet, Opik, Langtrace, Langwatch, and Langsmith, among others. The choice depends on your tech stack and the metrics you want to track. - How do I calculate the execution cost of an LLM in the cloud?
It is generally based on the number of tokens used (prompt and response). Multiply the total token count by the price per token charged by the provider (e.g., OpenAI). Be sure to monitor these numbers in real time to anticipate cost spikes. Usually, an LLM observability tool calculates this for you based on token usage (prompt and response) and the provider’s pricing. - What does it mean when an LLM “hallucinates”?
This refers to when an LLM generates content that seems valid but is actually false or fabricated. This phenomenon is common in language models and can impact the credibility of responses. - What is the difference between traditional monitoring and LLM monitoring?
Traditional monitoring focuses on metrics like response times, errors, and system logs. In LLMs, you also need to track text quality, moderation, and consistency metrics due to the non-deterministic nature of responses. - Do I have to pay double the cost if I use “LLM as a Judge”?
Yes, each additional call to the model (e.g., to evaluate the accuracy of another response) incurs an extra cost. However, this can be justified by reducing risks and improving the user experience.


