


The Mystery of the Cart Service and the Lying Metric: An E-commerce Black Friday Thriller

Picture the scene: it is Black Friday. You have coffee in one hand, the mouse in the other, and your Slack chat is red-hot. One of the most important campaigns is kicking off — we are talking about 30% of your company’s annual revenue in a single day.

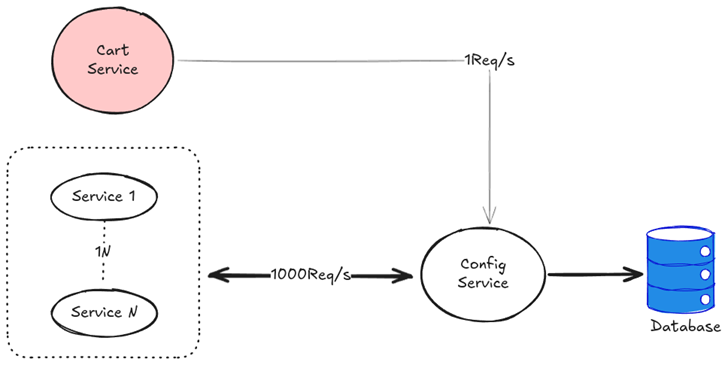
But to understand the drama that is about to unfold, let me first introduce the cast of our architecture (based on real events — any resemblance to your company is purely coincidental… or perhaps not):

  1. Cart Service (The Cashier): Responsible for processing items and totalling up the money. If this fails, we do not get paid. Today, it is the VIP.
  2. Config Service (The Brain): A central service that distributes configurations, feature flags and — most importantly today — the promotion rules. Our brain. Imagine failing and applying discounts beyond what was calculated.
  3. The database: The Brain’s Memory. Of course, our memory is also shared with other services.
  4. Other services: The Cart Service is not the only one that needs configurations; other services do as well. That is the real world of a distributed architecture, isn’t it?

Let us look at the architecture in a simplified form:

The Incident

It is 11:00 a.m. — a critical time on any day for our e-commerce platform. Our customers typically shop in the mornings, between 10:00 and 14:00. Now imagine that on Black Friday.

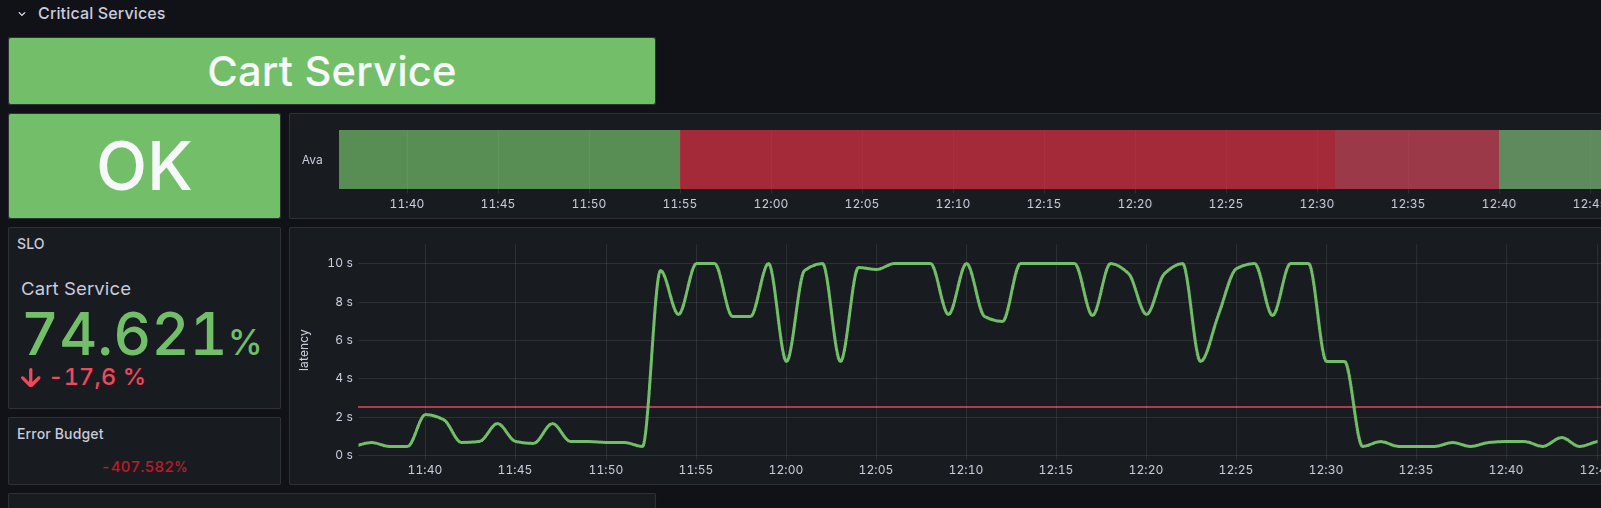
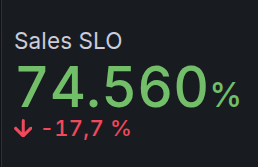
Suddenly, the calm is over. Alerts start firing. One of the most important SLOs — sales volume — is dropping.

Looking at our dashboards, it seems customers are indeed reaching the website and attempting to make purchases — but something is happening that prevents them from completing the process.

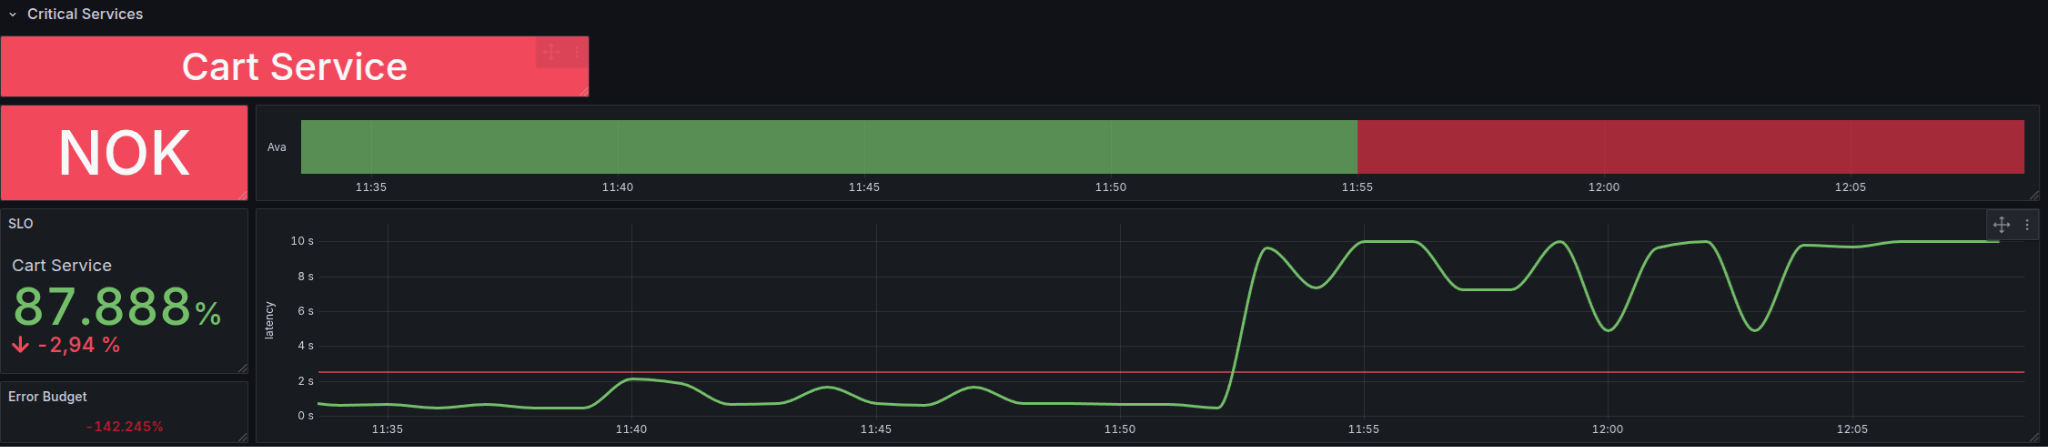
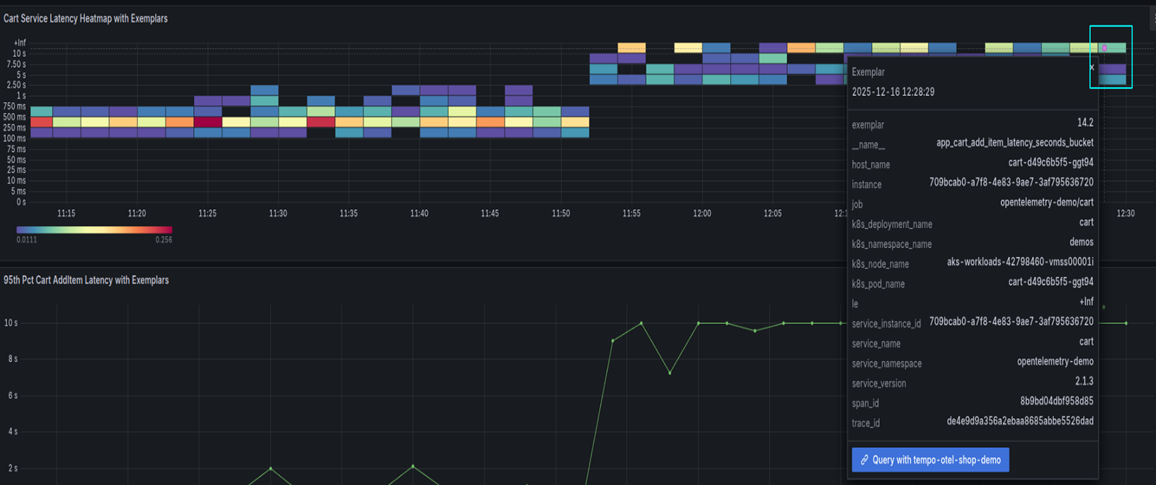
The operations team observes that latency has spiked in the Cart Service: processed orders are taking more than >10 seconds instead of the usual 800 ms. This is creating a critical situation across our systems.

  1. The customer refreshes the site and tries to make the purchase again.
  2. When it still does not complete, the customer gives up on the purchase.
  3. This triggers a cascading effect across other systems: because customers are making more and more attempts, the rest of the platform starts to be impacted as well.

The incident is escalated to the Cart Service team, who — sweating buckets — look at their traces and point the finger: “It’s the Config Service’s fault! You’re slowing us down!”

The Config Service team is then brought into the incident… and here comes the classic distributed-systems moment, the sort of phrase that ought to be banned by the Geneva Conventions:

“Impossible. Our dashboard is all green. Our P95 (95th percentile) is perfect. You’re the problem.”

The war begins. Who is lying? Spoiler: nobody is lying — but the metrics are missing CONTEXT.

The truth, very often, comes in multiple versions. It all depends on your point of view…

So how can it be that the Cart Service team sees the building on fire while the Config Service team is completely calm?

Here comes the business and technical lesson: error dilution.

  • The Config Service is very popular. It serves everyone: catalogue, login, homepage, search… it receives millions of requests per minute.
  • The Cart Service, although fundamental, represents a very small fraction of the Config Service’s overall traffic (if only everyone who visited our site actually bought something, eh?).
  • The problem: even if 100% of Cart Service requests are painfully slow, they are still just a drop in the ocean compared to the fast requests from all the other services.

When you look at the global average or the overall P95, those few slow requests are masked by the overwhelming majority of fast ones. The green dashboard is mathematically correct — but, functionally speaking… it is missing context.

The solution: context and correlation to the rescue

Without real observability, we would be lost in a three-hour meeting blaming the network or DNS. But luckily, our e-commerce platform is properly observed. And we do not just have metrics — we also have traces and logs.

Think of metrics, logs and traces as lenses that let us widen the perspective from which we are viewing the system.

To solve this, we do not need intuition, nor do we need to waste time wandering through endless dashboards — we need context:

  1. The Magnifying Glass (Trace): Because we propagate a Trace ID across services, we can ignore the noise and isolate one of those slow Cart Service transactions.

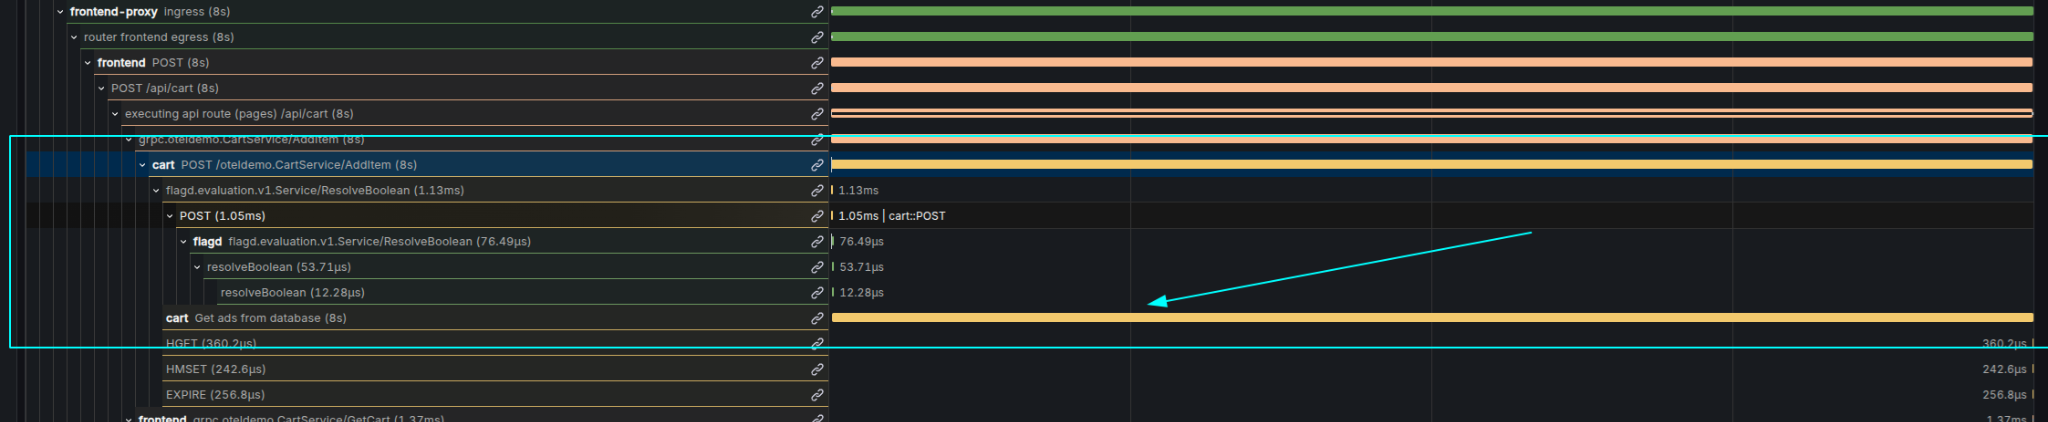
  2. The Thread: We follow the trace: Cart Service → Config Service → Database. We observe the end-to-end path of the Cart Service request and can clearly see that 98% of the request time is being spent on a database query: Get ads from database.

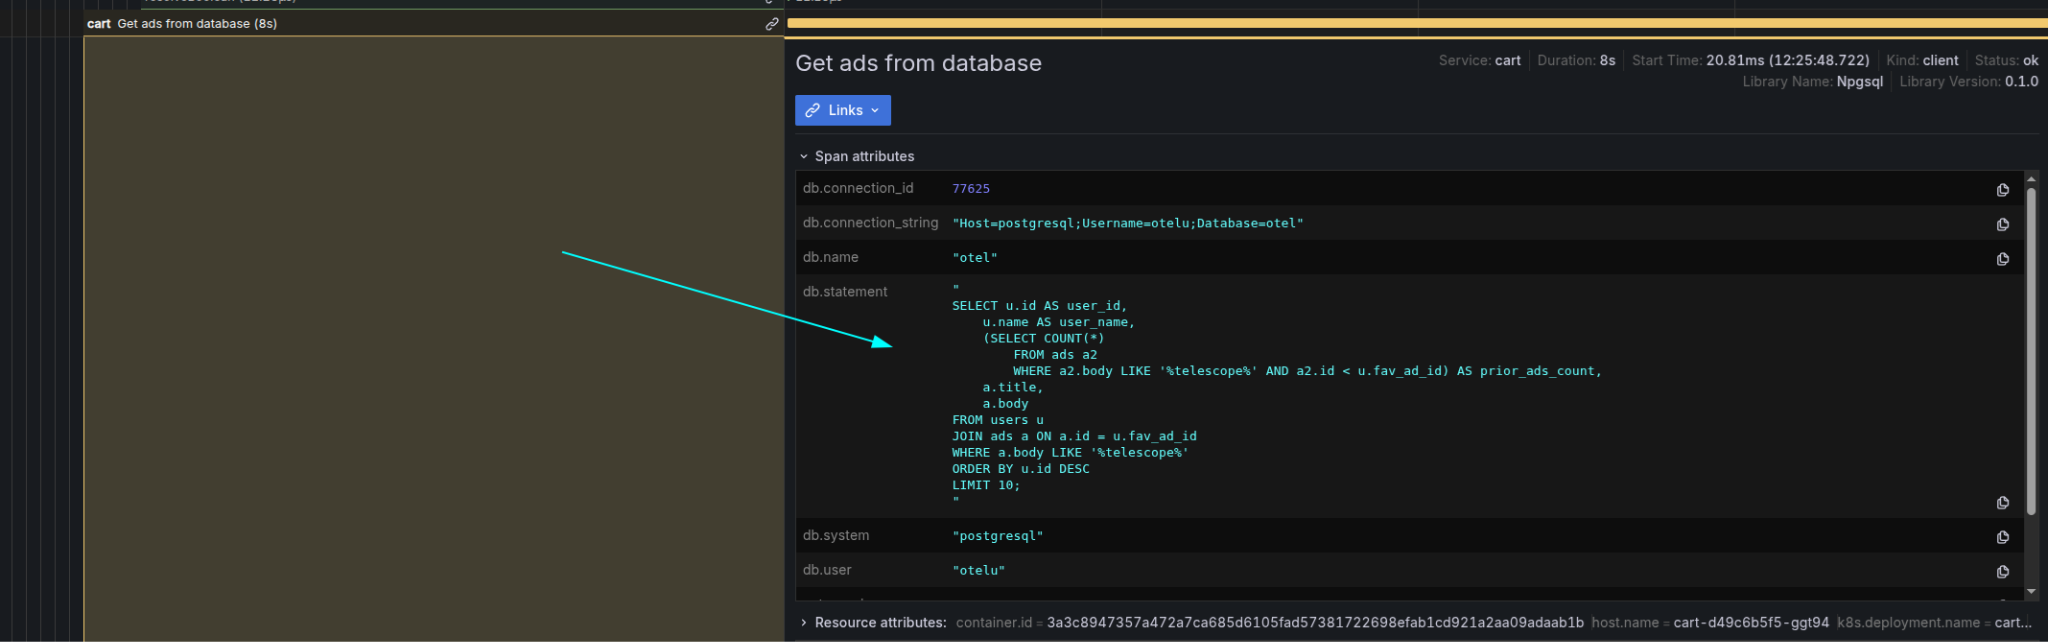
  3. The Finding: We have already identified the culprit, but… which database query are we running? Let’s zoom in on the trace.
    Hmm… that WHERE body LIKE ‘%telescope%’ does not look good at all.

  4. The Solution: It turns out our latest update to the recommendations feature included a query that is — putting it politely — not very well optimised. We roll it back and observe the system again.

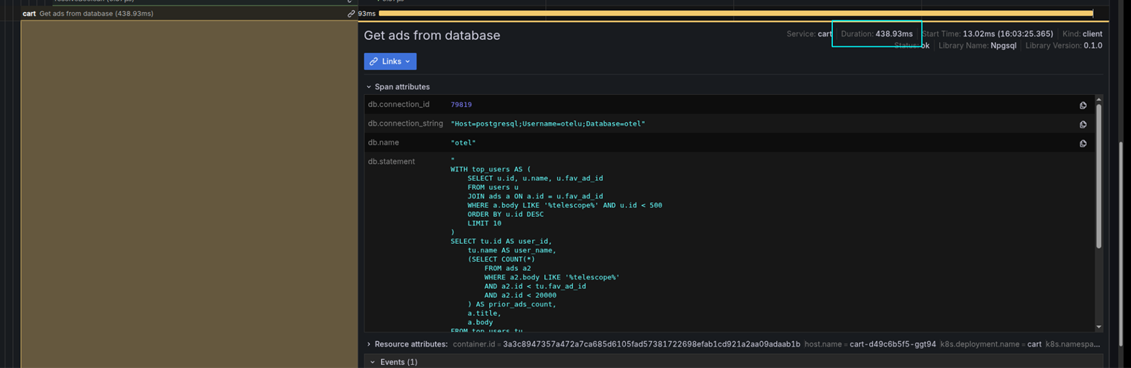
We breathe a sigh of relief… it looks like everything is returning to normal.

Alex Fortes
Picture of Ivan Blanco

Ivan Blanco

Did you find it interesting?

Leave a Reply

Your email address will not be published. Required fields are marked *

Related posts

Limitless scalability: the power of Zabbix Proxy and its automation within the IOMETRICS® Observability ecosystem

AI: To Agent or Not to Agent? That Is Not Always the Question.

Annual customer event: innovation, Autonomous Agents and haute cuisine

Want to know more?