Ensuring the smooth operation of today’s technology infrastructure is a constant challenge that demands robust, reliable tools. In an environment where systems are becoming increasingly complex, relying solely on basic data collection and reactive email overload when something fails is no longer a viable option.
Zabbix has established itself as an unrivalled enterprise-grade engine for distributed monitoring, standing out for its resilience through the use of Zabbix Proxies and its full automation capabilities with features such as Low-Level Discovery (LLD). However, the real strategic leap comes when this engine is natively integrated into a mature ecosystem such as IOMETRICS® Observability.
By combining Zabbix’s data collection power with the intelligent management and advanced deduplication capabilities of IOMETRICS® Alerta, together with automated real-time visualisation in Grafana, operational chaos disappears.
In this article, we will take an in-depth look at how this integration enables technical teams to turn noise into actionable insight, automate the data lifecycle and definitively evolve from a reactive “firefighting” approach towards a proactive model of uninterrupted visibility.
Introduction to Zabbix: the engine behind enterprise monitoring
Zabbix is an open source, enterprise-grade distributed monitoring solution. Designed to assess and track the performance and availability of networks, servers, virtual machines, applications, databases and cloud environments, Zabbix has established itself as one of the most reliable platforms on the market.
The true potential of Zabbix lies in its advanced capabilities and highly integrated architecture:
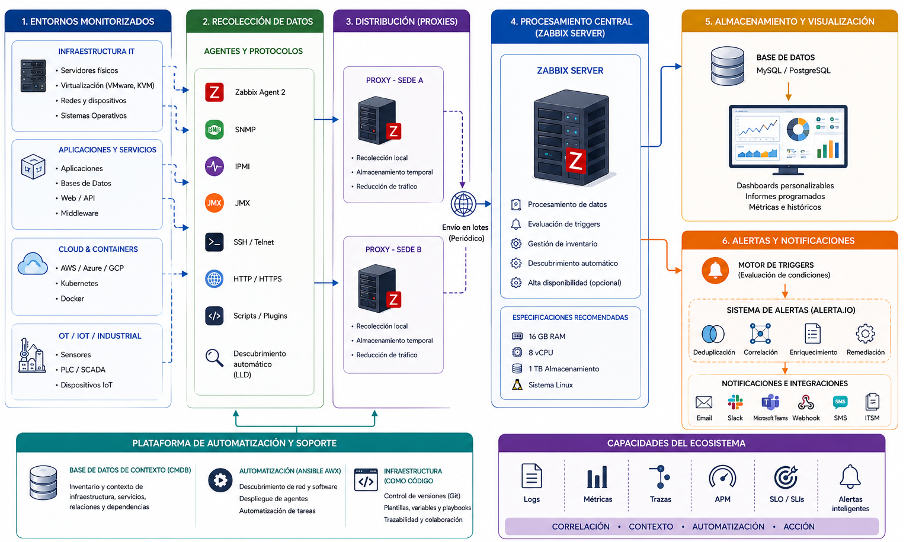
- Robust, distributed architecture: The system is built around Zabbix Server, the core component that processes data, evaluates failure conditions and issues notifications. Information and configurations are stored in a relational database, ensuring persistence. For complex, distributed or large-scale environments, the architecture allows Zabbix Proxies to be deployed. These act as intermediaries that collect metrics locally and send them to the main server, distributing the workload and continuing to operate even if connectivity is temporarily lost.
- Omnichannel data collection: Zabbix can extract telemetry through both active and passive checks. It natively supports protocols such as SNMP, IPMI, JMX and SSH, as well as direct monitoring of platforms such as VMware. In addition, it includes Zabbix Agent 2, an advanced version written in Go that supports the execution of simultaneous metrics and can be easily extended through plugins for specific technologies such as Docker, PostgreSQL or Redis.
- Intelligent detection through triggers: Rather than forcing operators to constantly review screens, Zabbix uses logical expressions known as triggers. These rules evaluate incoming data against predefined thresholds and can execute mathematical, historical and even predictive functions based on trends to anticipate failures.
- Full automation: The operational lifecycle is simplified through features such as network discovery and automatic agent registration. One of its standout capabilities is Low-Level Discovery — LLD — which automatically detects entities within a server, such as new disks, CPU cores or network interfaces, and applies the appropriate monitoring using standardised templates.
Distributed architecture and scalability: the power of Zabbix Proxy
As technology infrastructures grow, centralising all monitoring on a single server can create bottlenecks and performance issues. To address this challenge, the platform uses a distributed architecture based on Zabbix Proxy, a strategic component that acts as an intermediary collector operating on behalf of the main server.
Deploying proxies makes it possible to decentralise metric collection across anything from a small number to thousands of devices. Instead of the main server polling each machine individually, proxies take on this workload within their respective network segments, process the information and send it to the server in organised batches.
Implementing this distributed architecture brings critical operational advantages:
- Greater security and network simplicity: Monitoring isolated environments, remote branches or third-party cloud infrastructures is often a firewall management nightmare. With Zabbix Proxy, all agents within a remote network send their data to the local proxy, which only requires a single TCP connection to the central server. This drastically minimises exposed ports and reduces the attack surface.
- Resilience against communication outages: What happens if the connection between a remote site and the main data centre is lost? Zabbix Proxy includes local storage — either database-based or in-memory — to temporarily retain all telemetry. Once communication is restored, the proxy transfers the stored data, ensuring there are no gaps or losses in historical information.
- Accelerated performance — new in Zabbix 7.0: In the latest versions, proxies have taken a major performance leap by allowing collected data to be stored directly in RAM — using a memory buffer or hybrid mode — instead of relying exclusively on disk. This reduces resource consumption and increases processing speed by 10 to 100 times, making them ideal even for edge computing devices.
- High Availability — HA — and load balancing: For mission-critical environments, proxies can now be logically grouped into Proxy Groups. If one proxy in the group fails, the servers it was monitoring are automatically reassigned to other proxies in the same group within seconds. In addition, the system balances load by moving devices if it detects that one proxy is processing far more metrics than its peers.
In short, distributed architecture with Zabbix Proxy is what enables integrators such as IOMETRICS® Observability to scale monitoring without limits, ensuring continuous visibility regardless of whether the infrastructure is located in a single data centre or distributed worldwide.
The monitoring lifecycle in IOMETRICS® Observability
Zabbix’s technical capabilities become particularly powerful when orchestrated within an advanced ecosystem such as IOMETRICS® Observability, following clearly defined workflows:
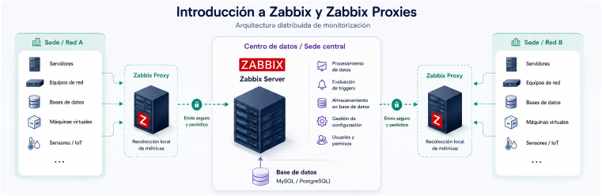
- Metric flow and collection: To collect metrics in an automated, unattended way, the infrastructure deployment relies on the following components:
- A context database that stores all structural information and inventory data related to what is going to be monitored.
- The Ansible AWX automation engine, responsible for network and software scanning, as well as the deployment of metric collection agents.
- A code-based platform with version control. Working with infrastructure as code provides a collaborative environment, full traceability for every change, and a centralised, secure location to host all deployment configurations and variables.
- Notification and alert management with IOMETRICS® Alerta When a trigger detects a failure, Zabbix acts as the initiator and delegates the workflow to the notification backend. Within this ecosystem, that role is handled by IOMETRICS Alerta, a powerful functional layer built on the Alerta.io project.
This system transforms the chaos and noise of mass alerts into actionable information through key capabilities:
- Flexible deduplication: Enables events to be deduplicated using specific attributes. If a new alert shares the same value for that attribute as another already active alert, it is automatically consolidated.
- Intelligent correlation: The system dynamically groups alerts through providers that evaluate time-based metrics, topology metrics — measuring the network distance between affected nodes — and text metrics, using Machine Learning to assess similarities in event descriptions.
- Asynchronous recovery and alerting: To avoid slowing down event processing with slow integrations, such as ticket creation in other platforms, alert handling is performed asynchronously. In addition, the system includes automated remediation providers that attempt to resolve the incident before interrupting the technician with a notification.
- Contextualisation: Alerts are enriched through declarative rules, adding critical information such as the affected service, severity or owner, without needing to modify the original data source.
- Automated, standardised information visualisation
All telemetry collected by Zabbix and all managed events need to be interpreted at a glance. To achieve this, IOMETRICS® Observability uses Grafana, configuring specific data sources for each environment.
The true value of this layer lies in the full automation of visibility. Thanks to the rigorous standardisation we maintain in the organisation of hosts and groups within Zabbix, the cycle closes automatically: as soon as an agent is deployed unattended and the server begins sending metrics, it is continuously autodiscovered. When it matches the predefined rules, the new server automatically appears in the standard IOMETRICS® Observability dashboards.
This removes the need to manually create panels for every new machine added to the infrastructure. By automating the dashboard lifecycle, it ensures a centralised graphical representation, tailored to different operational roles — operators, architects and business teams — and delivered in strict real time from the very first second.
Conclusion: from traditional monitoring to intelligent observability
Critical infrastructure monitoring can no longer be limited to simple data collection and the generation of email notifications every time a service fails. As technology environments become increasingly complex, tools must evolve to deliver fast, scalable and contextualised responses.
Zabbix has proven to be an unrivalled engine for this purpose. Thanks to its open source nature, powerful trigger system and distributed architecture through Zabbix Proxy, it provides the solid, resilient foundation any large organisation needs to extract telemetry, regardless of where its systems are hosted.
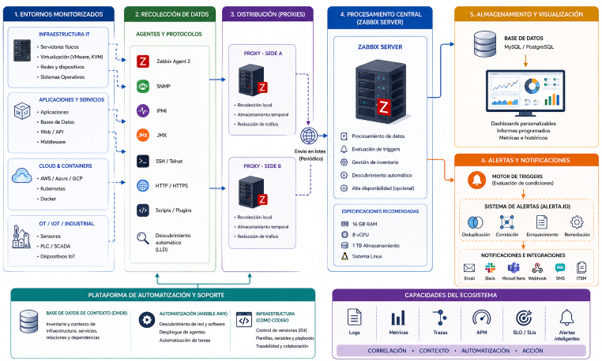
However, the real differentiating value is achieved when this engine is integrated into a mature ecosystem such as IOMETRICS® Observability. The combination of Zabbix with deployment automation, intelligent notification management through IOMETRICS® Alerta and automated visualisation in Grafana creates the perfect synergy.
Instead of operations teams having to deal with alert fatigue and manual bottlenecks, this integration enables them to:
- Transform noise into actionable information through advanced deduplication and correlation.
- Act autonomously through automated remediation mechanisms before interrupting technical teams.
- Ensure immediate, standardised visibility from the very moment a server connects to the network.
Ultimately, integrating Zabbix within the IOMETRICS® Observability ecosystem means moving from a reactive “firefighting” approach to a proactive operating model, where technology works in favour of technical teams, maximising service availability and supporting business success.
Now we want to hear from you: what challenges are you currently facing when managing alerts across your infrastructure? Have you already implemented distributed architectures with proxies in your organisation?
Leave your questions or experiences in the comments section. Datadope’s team of specialists will be happy to discuss them with you and offer tailored solutions for your observability challenges.
Sergio Ferrete