
The end of blind debugging through Nominal Traceability
Introduction
Is your infrastructure green, but a user cannot complete their purchase? That is exactly the problem that traditional observability does not manage to solve.
A backend responding with HTTP200 can perfectly coexist with a blocked interface or a rendering error on the web. And if part of your application logic runs on the client, monitoring only the server means you are only seeing half the picture.
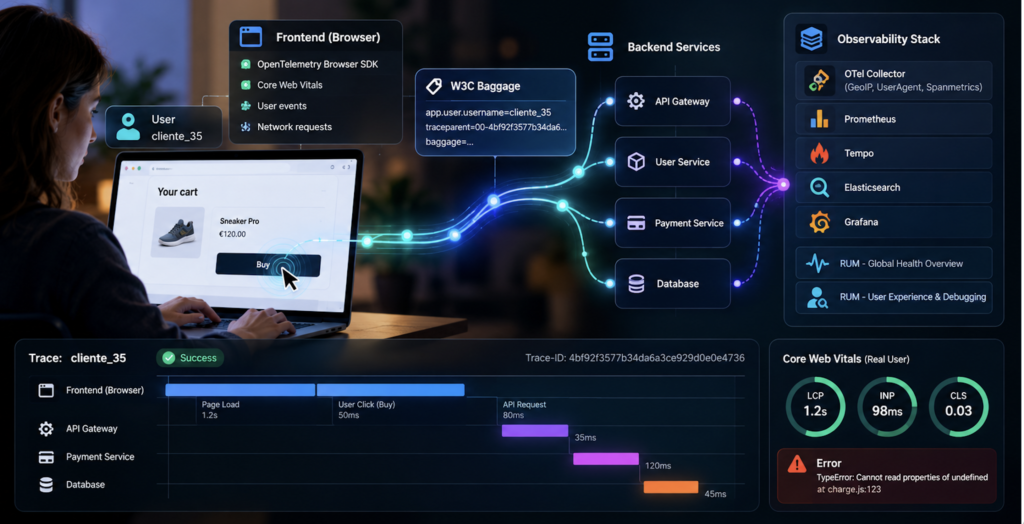
At Datadope, we solve this with User Experience Monitoring (UEM) based on OpenTelemetry and the W3C Baggage standard. The idea is simple: extend traceability to the browser to know exactly what happened to each user. With this, you will get:
- Nominal Observability: Each trace linked to a real user, not to an IP.
- Reduction in incident resolution time (MTTR): We trace the complete flow from the click in the browser to the database query.
- Unified Correlation: Core Web Vitals and backend health in a single dashboard.
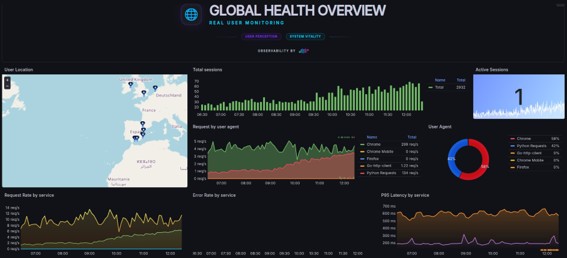
Figure 1: Real-time correlation between user experience and backend performance.
1. The problem with monitoring only the server
When you only analyse traces from the backend, there are three things you always miss:
- You do not know who experienced the error. Without user metadata in the Baggage, correlating a failure with a specific client is practically impossible. You are left looking at anonymous logs for patterns.
- You do not see the client’s actual latencies. The server cannot measure how long a page takes to render. A 50ms API response means nothing if the user is looking at a frozen screen.
- Frontend errors simply do not arrive. JavaScript failures or network errors (CORS, timeouts) do not appear in the server logs. Without that data, a complete RCA is impossible.
The solution: the traceparent has to originate in the browser. Only then do you have the complete picture.
2. Architecture: the complete stack
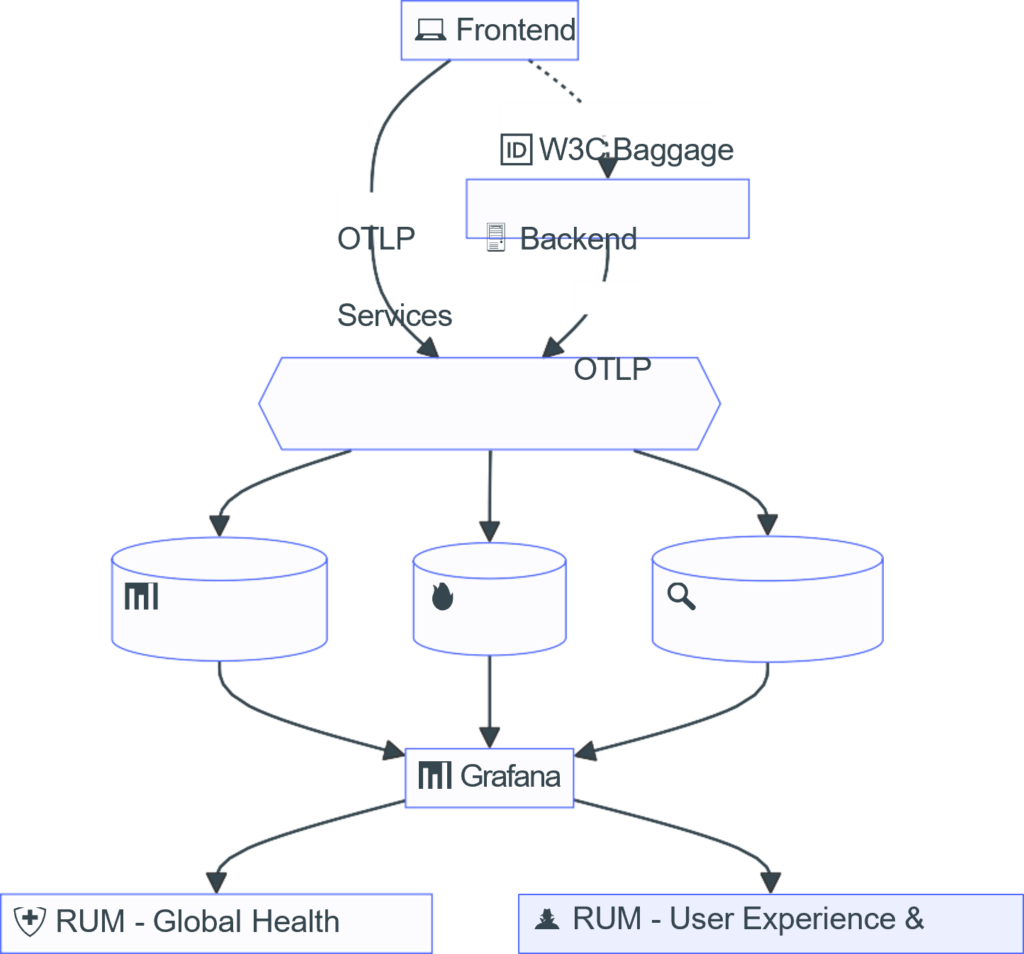
The objective is to connect what the user experiences on their screen with what happens in the backend services, eliminating the silos between Frontend, Backend and SRE.
The components:
- OpenTelemetry Browser SDK: Instruments the application on the client and captures web events, Core Web Vitals and network requests.
- W3C Baggage: The fundamental standard that makes it possible to inject the user identity into the HTTP headers.
- Observability Stack (OTel Collector + Prometheus + Elasticsearch + Tempo + Grafana): the OTel Collector processes and enriches the telemetry. Prometheus and Tempo manage metrics and traces, Elasticsearch manages logs. Grafana unifies everything.
3. Implementation: propagating the user identity
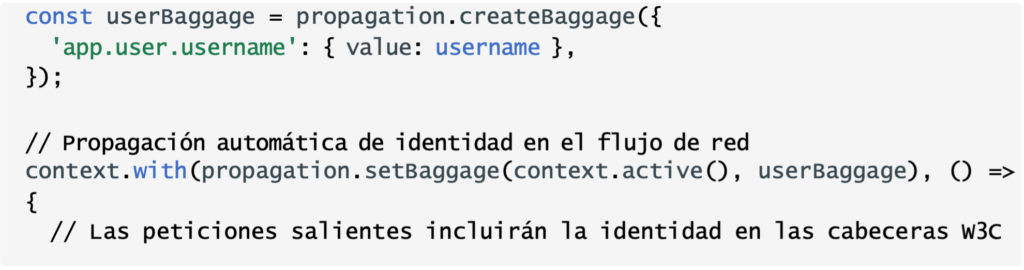
OpenTelemetry Baggage is what makes all of this possible. It makes it possible to inject metadata into the HTTP headers and for it to travel automatically through all services, without modifying any of them.
3.1. Injection on the client
At the start of the session, we inject the user identity into the active context. From that point onwards, OpenTelemetry automatically propagates it in every outgoing request.
3.2. Extraction in the backend
The backend services read those attributes from the Baggage and inject them into their own Spans. The result: each distributed trace carries the identity of the user who originated it, end to end.
4. Operational Impact
A. RCA (Root Cause Analysis) in 60 seconds
“client_35” clicks “Buy” and something fails. With nominal traceability, the process is direct:
- In Grafana, you filter the complete dashboard by entering the user in the variable.
- You locate the trace marked with an error and click its Trace-ID.
- Immediately, you have the waterfall view of the trace and its correlated logs, and you detect that it is a code bug on line 123 of the charge.js method.
No screenshots. No reproducing steps. No searching through thousands of lines of anonymous logs.
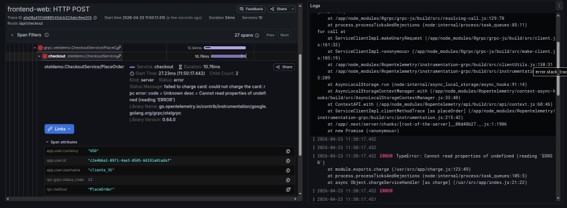
Figura 3 : Detalle de trazabilidad de la sesión de “cliente_35” hasta el error encharge.js.
B. Real Core Web Vitals
Synthetic probes do not reflect what each user experiences on their device. With OpenTelemetry, we capture the exact Core Web Vitals of each session. This allows you to distinguish whether a performance problem is your code or the client’s connection.
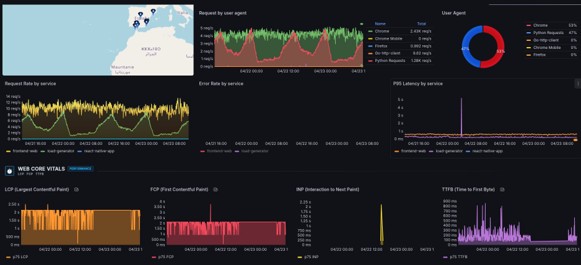
Figure 4: Web Core Vitals analysis segmented by User Agent and location.
C. Cardinality control
There is a real risk when measuring the frontend: if you send dynamic URLs (e.g. /cart/ceckout/8f14-4b…) directly to Prometheus, storage explodes.
The solution is to normalise at source: we sanitise the routes on the client ( /cart/checkout/:uuid ) before exporting them as metrics. We store the complete and nominal URL only as a Span attribute in Tempo. This gives us full visibility, but without driving up costs.
5. Business impact
Beyond the dashboards, this has a direct impact on the profit and loss account:
- Fewer lost sales: You detect bottlenecks in the checkout before the impact on revenue becomes serious.
- More efficient support: The support team stops asking users for screenshots to understand what happened.
- No vendor lock-in: As it is based on the OpenTelemetry standard, you are not tied to any specific backend.
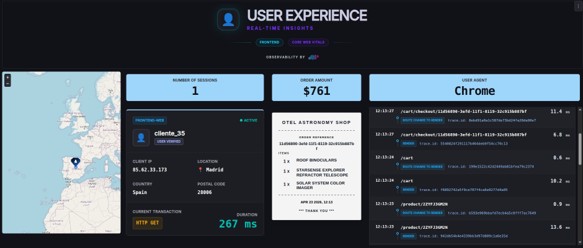
Figure 5: Session record for “client_35”.
6. Considerations to bear in mind
- Protect personal data: W3C Baggage travels in all outgoing HTTP headers. If you have third-party APIs, tokenise or hash the identifiers before propagating them. In addition, do not send personally identifiable information (PII) to the observability backend; instead, use SDK-level masking or filtering at OTel Collector level.
- CORS and connectivity: Send telemetry through a proxy or a same-origin endpoint instead of going directly to the collector. This avoids CORS issues and simplifies the security configuration.
Conclusion
Modern observability is not about accumulating more logs, but about moving from “something has failed for someone” to “I know exactly what happened to this user, at this moment, on this device”. With OpenTelemetry extended to the browser and W3C Baggage propagating identity, that question can be answered in seconds, not hours.
If your team still relies on screenshots to debug frontend errors, there is a better way to do it.

Alejandro Naranjo Martín

